Unlock a world of possibilities! Login now and discover the exclusive benefits awaiting you.
- Qlik Community
- :
- All Forums
- :
- QlikView App Dev
- :
- Re: blank field to be used in expression
- Subscribe to RSS Feed
- Mark Topic as New
- Mark Topic as Read
- Float this Topic for Current User
- Bookmark
- Subscribe
- Mute
- Printer Friendly Page
- Mark as New
- Bookmark
- Subscribe
- Mute
- Subscribe to RSS Feed
- Permalink
- Report Inappropriate Content
blank field to be used in expression
Hi all,
I'm relatively new to qv and I need your help!
First issue:
Let's say I have this table
| Category | TY | LY | FC | ΔLY(%) | ΔFC(%) |
| TURNOVER | 82,547 | 76,214 | 80,470 | 8% | 3% |
| DIRECT COSTS | -16,385 | -18,027 | -18,636 | -9% | -12% |
| OVERHEADS | -22,753 | -26,155 | -23,239 | -13% | -2% |
| DEPRECIATION | -6,694 | -6,694 | -6,694 | 0% | 0% |
| - | -40 | -14,108 | -252 | -100% | -84% |
| Profit | 36,675 | 11,229 | 31,649 | 227% | 16% |
I need to use the field - (category column) in set analysis in order to calculate some metrics. Please note that the source excel table I has only the following fields: Turnover,direct costs, overheads and depreciation. I assume that the - field is just blank in my source table. So how do I use this field in set analysis?
I have tried Sum({$<YEAR#={2014},Category={''}>}Actual#) and Sum({$<YEAR#={2014},Category={'-'}>}Actual#) with no luck.
Second issue: The profit field (bottom category column) was created using partial sum under presentation tab.
Can I for example do the same for Turnover minus Direct costs and have a new field lnamed Gross Margin (TURNOVER - DIRECT COSTS) without having to do serious scripting work?
Thank you for your time fellas
- « Previous Replies
-
- 1
- 2
- Next Replies »
- Mark as New
- Bookmark
- Subscribe
- Mute
- Subscribe to RSS Feed
- Permalink
- Report Inappropriate Content
Dear,
It's not static.
on selection it will effect
- Mark as New
- Bookmark
- Subscribe
- Mute
- Subscribe to RSS Feed
- Permalink
- Report Inappropriate Content
I will give it a go and come back to you.
Thanks a lot!
- Mark as New
- Bookmark
- Subscribe
- Mute
- Subscribe to RSS Feed
- Permalink
- Report Inappropriate Content
Unfortunately it is not working. When I make other selections the table keeps showing the original values I put in the script.
Any other ideas?
Thank you for your time
- Mark as New
- Bookmark
- Subscribe
- Mute
- Subscribe to RSS Feed
- Permalink
- Report Inappropriate Content
Dear Gysbert,
I have followed your suggestions by doing this (I hope this is what you meant) :
Load*Inline [
Group, Category
Turnover, Turnover
Direct Costs, Direct Costs
Overheads, Overheads
Depreciation, Depreciation
Gross Margin, Turnover
Gross Margin, Direct Costs
Profit, Turnover
Profit, Direct Costs
Profit, Overheads
Profit, Depreciation
];
So, I get this ( by selecting group in dimension):
| Group | TY | LY | FC | ΔLY(%) | ΔFC(%) |
| - | 21,744 | 20,056 | 21,514 | 8% | 1% |
Numbers are correct but still it does not show Turnover,Direct Costs, Gross Margin etc
Am I missing something?
Thank you for your help!
- Mark as New
- Bookmark
- Subscribe
- Mute
- Subscribe to RSS Feed
- Permalink
- Report Inappropriate Content
It seems you missed my post above, so I'll post it again here:
Can you post a small document that demonstrates the problem? See this document if you're worried about confidentiality: Preparing examples for Upload - Reduction and Data Scrambling
talk is cheap, supply exceeds demand
- Mark as New
- Bookmark
- Subscribe
- Mute
- Subscribe to RSS Feed
- Permalink
- Report Inappropriate Content
Hi,
Please find attached reduced/scrambled file. Is it possible to make it look like the picture below?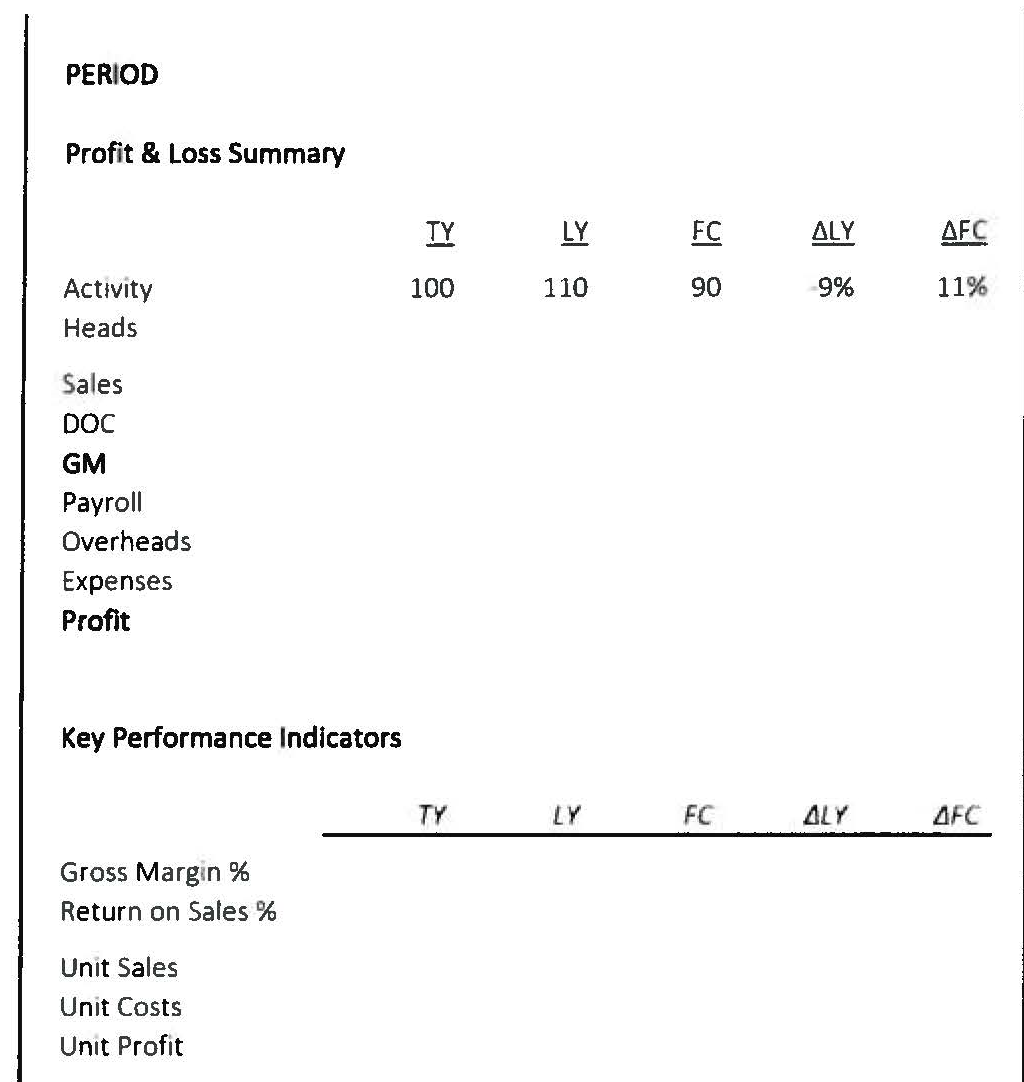
Thanks for your help btw
- Mark as New
- Bookmark
- Subscribe
- Mute
- Subscribe to RSS Feed
- Permalink
- Report Inappropriate Content
I didn't see any evidence that you implemented my suggestion in the document you posted.
Perhaps this blog post will give you ideas: How IntervalMatch Solved My Profit and Loss Dilemma
talk is cheap, supply exceeds demand
- « Previous Replies
-
- 1
- 2
- Next Replies »