Unlock a world of possibilities! Login now and discover the exclusive benefits awaiting you.
- Qlik Community
- :
- All Forums
- :
- QlikView App Dev
- :
- % calculation
- Subscribe to RSS Feed
- Mark Topic as New
- Mark Topic as Read
- Float this Topic for Current User
- Bookmark
- Subscribe
- Mute
- Printer Friendly Page
- Mark as New
- Bookmark
- Subscribe
- Mute
- Subscribe to RSS Feed
- Permalink
- Report Inappropriate Content
% calculation
Hello,
i am new to qlikview and i need to achieve this requirement.
Expressions are calculated like
1) =count(DISTINCT{$<[Site Visit Hit Source]={"<>5,7,8,9"}, [Site Visit Post Page Event] = {0}>} [Visitor ID])
2) =count(DISTINCT{$<[Site Visit Hit Source]={"<>5,7,8,9"}, [Site Visit Post Page Event] = {0}>} [Visitor ID]&'_'&[Site Visit Vis Num])
3) =sum({$<[Site Visit Hit Source]={"<>5,8,9"}, [Site Visit Post Page Event] = {0}>} [Site Visit Record Count])
like this I have 8 expressions
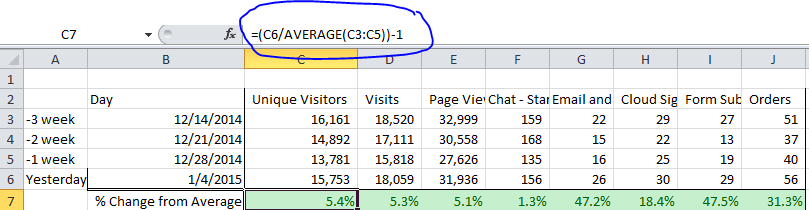
and my requirement i have to calculate the highlighted value in my table chart.
%change from average value needs to calculated and day is coming from time dimension table.
can anyone help me on this case.
regards,
Kumar
- Tags:
- new_to_qlikview
- Mark as New
- Bookmark
- Subscribe
- Mute
- Subscribe to RSS Feed
- Permalink
- Report Inappropriate Content
do you have daily data or only weekly info ?
and are you only looking for the last three weeks ?
under this assumption you could pull the latest date with a max and then apply a range for the last three weeks
=
(count(DISTINCT{$<[Site Visit Hit Source]={"<>5,7,8,9"}, [Site Visit Post Page Event] = {0}, Day = {"$(=MAX(Day))"}>} [Visitor ID])
/
rangeavg(
count(DISTINCT{$<[Site Visit Hit Source]={"<>5,7,8,9"}, [Site Visit Post Page Event] = {0}, Day = {">=$(=MAX(Day,2)) <$(=MAX(Day))"}>} [Visitor ID]),
count(DISTINCT{$<[Site Visit Hit Source]={"<>5,7,8,9"}, [Site Visit Post Page Event] = {0}, Day = {">=$(=MAX(Day,3)) <$(=MAX(Day,2))"}>} [Visitor ID]),
count(DISTINCT{$<[Site Visit Hit Source]={"<>5,7,8,9"}, [Site Visit Post Page Event] = {0}, Day = {">=$(=MAX(Day,4)) <$(=MAX(Day,3))"}>} [Visitor ID])
)
)-1
another option would be to use an aggr breakdown by day
=
(count(DISTINCT{$<[Site Visit Hit Source]={"<>5,7,8,9"}, [Site Visit Post Page Event] = {0}, Day = {"$(=MAX(Day))"}>} [Visitor ID])
/
avg(
aggr(count(DISTINCT{$<[Site Visit Hit Source]={"<>5,7,8,9"}, [Site Visit Post Page Event] = {0}, Day = {">=$(=MAX(Day,4)) <$(=MAX(Day))"}>} [Visitor ID]),Day)
)
)-1
I didn't test none of this but it can get you started
- Mark as New
- Bookmark
- Subscribe
- Mute
- Subscribe to RSS Feed
- Permalink
- Report Inappropriate Content
Hi Kumar,
I am not sure if you like my solution, but I just wanted to throw my two cents into this discussion. I did something similar to yours a while ago, here is a screenshot of my solution incorporated to your question:
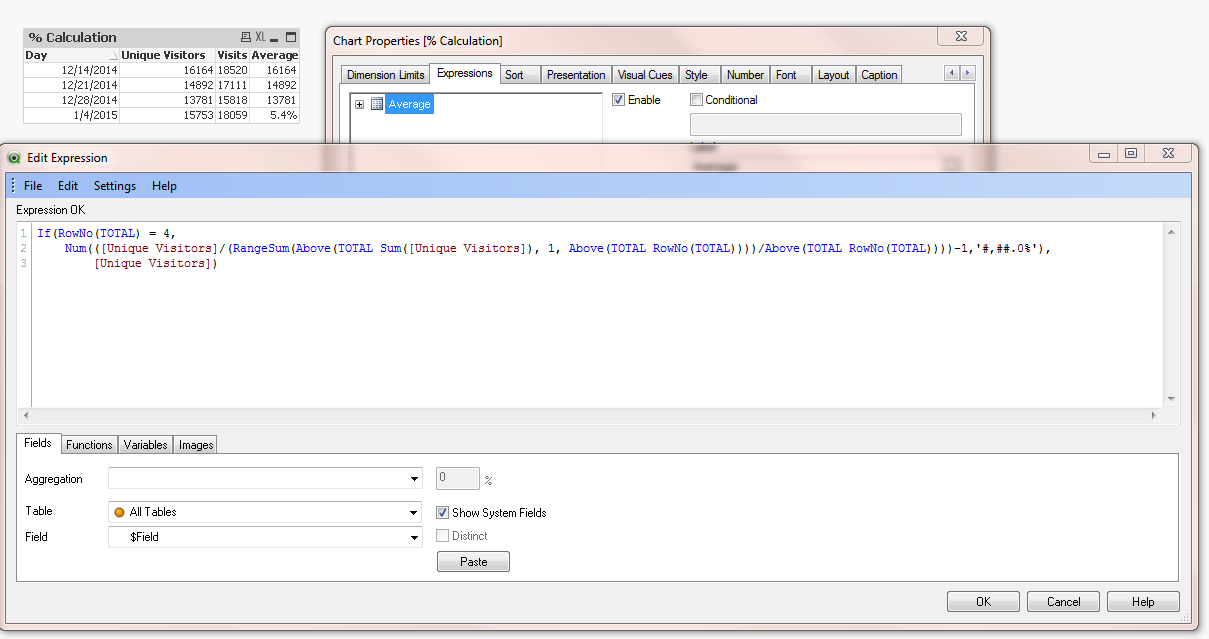
It is not an elegant solution, but again just wanted to give you a different idea. The last line shows the percentage that you want to show.
I am also attaching the qvw.
Hope this helps.
Thanks
- Mark as New
- Bookmark
- Subscribe
- Mute
- Subscribe to RSS Feed
- Permalink
- Report Inappropriate Content
My data should be displayed on weekly basis. And I want 4 weeks of data. This is like 7 days should be deducted from each week.
Yesterdays(today()-1)
last week(yesterday-7)
last to lat week(last week - 7)
last 3 weeks(last to last week -7)
And last columns should be added at the end of the table as % calculation.
Regards,
Kumar
- Mark as New
- Bookmark
- Subscribe
- Mute
- Subscribe to RSS Feed
- Permalink
- Report Inappropriate Content
I get that you want to display the data in weeks, but how is the data aggregated in your system ?
- Mark as New
- Bookmark
- Subscribe
- Mute
- Subscribe to RSS Feed
- Permalink
- Report Inappropriate Content
You may need to post some sample data.
Thanks
- Mark as New
- Bookmark
- Subscribe
- Mute
- Subscribe to RSS Feed
- Permalink
- Report Inappropriate Content
it is in daily basis.
- Mark as New
- Bookmark
- Subscribe
- Mute
- Subscribe to RSS Feed
- Permalink
- Report Inappropriate Content
Qvd files size are huge.
Regards,
kumar
- Mark as New
- Bookmark
- Subscribe
- Mute
- Subscribe to RSS Feed
- Permalink
- Report Inappropriate Content
Try to sample a few rows, not the whole qvds.
Thanks
- Mark as New
- Bookmark
- Subscribe
- Mute
- Subscribe to RSS Feed
- Permalink
- Report Inappropriate Content
see if this example works for you