Unlock a world of possibilities! Login now and discover the exclusive benefits awaiting you.
- Qlik Community
- :
- All Forums
- :
- QlikView App Dev
- :
- Re: chart problem
- Subscribe to RSS Feed
- Mark Topic as New
- Mark Topic as Read
- Float this Topic for Current User
- Bookmark
- Subscribe
- Mute
- Printer Friendly Page
- Mark as New
- Bookmark
- Subscribe
- Mute
- Subscribe to RSS Feed
- Permalink
- Report Inappropriate Content
chart problem
I got this chart
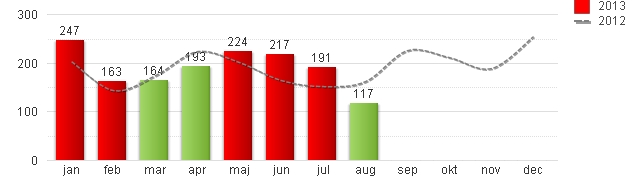
showing amount af items sold in 2012 and 2013, - but items in 2013 consists of two groups ex. carlsberg and tuborg so i´d like the column for jan 2013 to be divided still in one column but with two colors and the amount inside segment.
I make this chart with two expressions
=count(if(year='2013',solditems)) and count(if(year='2012',solditems))
I´ve tried to add more dimensions but it fails
I want somthing like this
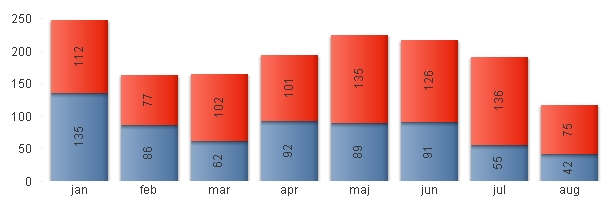
this is made with 3 dimension and one expression showing 2013 but then i´m missing 2012 as the dotted line?????
- « Previous Replies
-
- 1
- 2
- Next Replies »
- Mark as New
- Bookmark
- Subscribe
- Mute
- Subscribe to RSS Feed
- Permalink
- Report Inappropriate Content
sorry - but I cant add sampledata
- Mark as New
- Bookmark
- Subscribe
- Mute
- Subscribe to RSS Feed
- Permalink
- Report Inappropriate Content
What is the chart type you are using? With chart type 'Combo Chart', this should work fine.
- Mark as New
- Bookmark
- Subscribe
- Mute
- Subscribe to RSS Feed
- Permalink
- Report Inappropriate Content
Hi
i think stack bar chart will help you.
go to chart properties -> Style tab and select SubType "Stacked"
- Mark as New
- Bookmark
- Subscribe
- Mute
- Subscribe to RSS Feed
- Permalink
- Report Inappropriate Content
I do use combo chart
- Mark as New
- Bookmark
- Subscribe
- Mute
- Subscribe to RSS Feed
- Permalink
- Report Inappropriate Content
Hey - I did not see that possibility - thanx - now I just need to separate 2012 and 2013 so 2012 is a dotted line and 2013 is stacked
- Mark as New
- Bookmark
- Subscribe
- Mute
- Subscribe to RSS Feed
- Permalink
- Report Inappropriate Content
add two expression for 2012 and 2013
hope it helps
- Mark as New
- Bookmark
- Subscribe
- Mute
- Subscribe to RSS Feed
- Permalink
- Report Inappropriate Content
You cant use stacked when using 2 expressions?? I only want stacked for 2013 and a dotted line for 2012??????
- Mark as New
- Bookmark
- Subscribe
- Mute
- Subscribe to RSS Feed
- Permalink
- Report Inappropriate Content
tried that - but doent work with 2 expressions
- Mark as New
- Bookmark
- Subscribe
- Mute
- Subscribe to RSS Feed
- Permalink
- Report Inappropriate Content
With Combo chart type:
Please check in the expression tab, if for the second expression, display options (Symbol and Line) are checked.
- « Previous Replies
-
- 1
- 2
- Next Replies »