Unlock a world of possibilities! Login now and discover the exclusive benefits awaiting you.
- Qlik Community
- :
- All Forums
- :
- QlikView App Dev
- :
- chart with time of timestamp
- Subscribe to RSS Feed
- Mark Topic as New
- Mark Topic as Read
- Float this Topic for Current User
- Bookmark
- Subscribe
- Mute
- Printer Friendly Page
- Mark as New
- Bookmark
- Subscribe
- Mute
- Subscribe to RSS Feed
- Permalink
- Report Inappropriate Content
chart with time of timestamp
Hello everyone,
i am trying to build a line chart timestamp vs value. The timestamp must be in format HH:MM and just 30 in 30 minutes.
I have this table:
| Timestamp(tstamp) | Value |
|---|---|
| 26-07-2016 17:00:10 | 25 |
| 26-07-2016 17:00:15 | 26 |
| 26-07-2016 17:30:00 | 25 |
| 26-07-2016 17:30:05 | 25 |
| 26-07-2016 17:42:00 | 25 |
| 26-07-2016 17:42:05 | 34 |
| 26-07-2016 17:43:10 | 25 |
| 26-07-2016 17:43:16 | 25,1 |
| 26-07-2016 18:00:10 | 27 |
| 26-07-2016 18:00:15 | 27 |
My line chart has as dimension the time from timestamp (HH:MM) (17:00, 17:30, 18:00, etc) and has as expression the value.
My current result is:
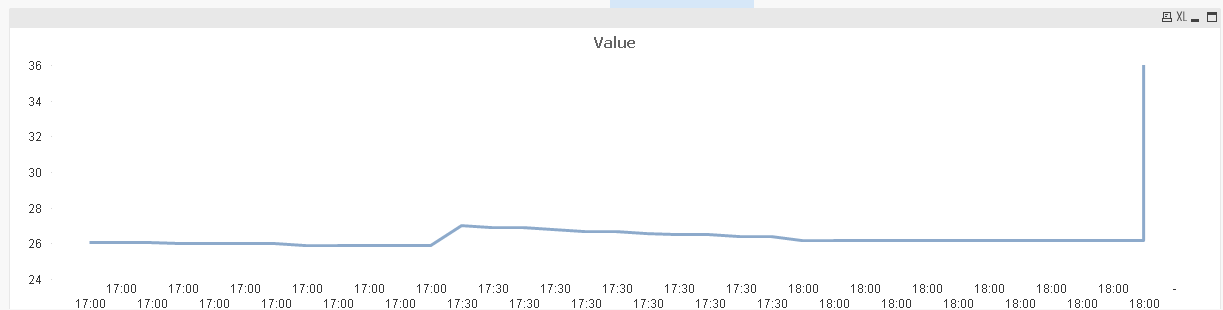
My dimension is:
=if(Minute(tstamp)=00 or Minute(tstamp)=30 ,timestamp(Timestamp(tstamp, 'YYYY-MM-DD HH:MM:SS'),'h:mm'))
My expression is the value.
Can someone help me with this problem?
Greetings
- « Previous Replies
-
- 1
- 2
- Next Replies »
Accepted Solutions
- Mark as New
- Bookmark
- Subscribe
- Mute
- Subscribe to RSS Feed
- Permalink
- Report Inappropriate Content
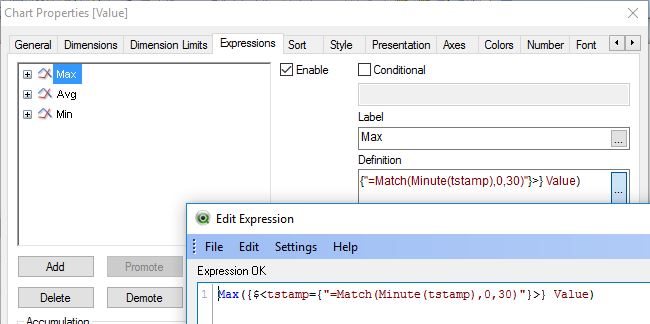
or without changing the script, i.e. only using your tstamp field:

hope this helps
regards
Marco
- Mark as New
- Bookmark
- Subscribe
- Mute
- Subscribe to RSS Feed
- Permalink
- Report Inappropriate Content
What are you expecting in your chart? Can you provide the numbers that you expect to see on your chart?
- Mark as New
- Bookmark
- Subscribe
- Mute
- Subscribe to RSS Feed
- Permalink
- Report Inappropriate Content
Try this as your dimension:
=If(Minute(tstamp) = 0 or Minute(tstamp) = 30, Time(Round(Frac(tstamp), (1/24*60)),'h:mm'))
or this:
Time(Round(Frac(tstamp), (1/48)),'h:mm')
- Mark as New
- Bookmark
- Subscribe
- Mute
- Subscribe to RSS Feed
- Permalink
- Report Inappropriate Content
I suggest to split the timestamp into a date and a time:
date(floor(tstamp)) as Date,
time(frac(tstamp)) as Time
and connecting them with a master-calendar and a timetable, here you could find many explanations and examples: How to use - Master-Calendar and Date-Values.
and your half-hourly dimension could be included within the timetable or created with an expression like:
time(round(frac(tstamp), 1 / 24 / 2)) as TimeHalfHourly
- Marcus
- Mark as New
- Bookmark
- Subscribe
- Mute
- Subscribe to RSS Feed
- Permalink
- Report Inappropriate Content
First thank you by your answer.
The perfect thing would be on 17h show all values (25 and 26) but with just one dimension value (17h)... not many like my chart.
17:30 -> 25 and 25
18:00 -> 25 and 25
and so on
- Mark as New
- Bookmark
- Subscribe
- Mute
- Subscribe to RSS Feed
- Permalink
- Report Inappropriate Content
Edit the script would help me but i can't change the script 
- Mark as New
- Bookmark
- Subscribe
- Mute
- Subscribe to RSS Feed
- Permalink
- Report Inappropriate Content
Then use: time(round(frac(tstamp), 1 / 24 / 2)) as dimension within your chart.
- Marcus
- Mark as New
- Bookmark
- Subscribe
- Mute
- Subscribe to RSS Feed
- Permalink
- Report Inappropriate Content
Did you try one of these two dimensions:
=If(Minute(tstamp) = 0 or Minute(tstamp) = 30, Time(Round(Frac(tstamp), (1/24*60)),'h:mm'))
or this:
Time(Round(Frac(tstamp), (1/48)),'h:mm')
- Mark as New
- Bookmark
- Subscribe
- Mute
- Subscribe to RSS Feed
- Permalink
- Report Inappropriate Content
Hi,
maybe this helps
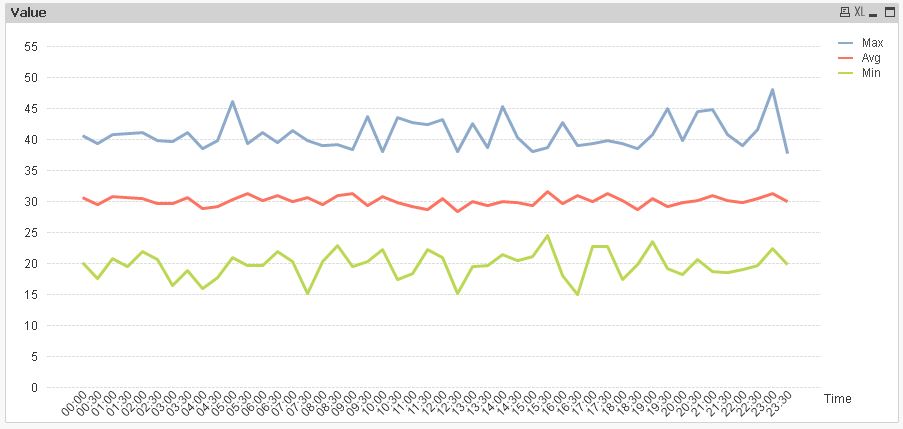

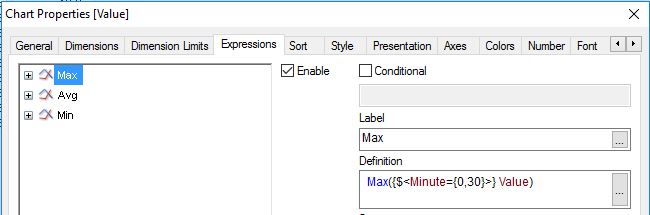
table1:
LOAD *,
    DayName(tstamp) as Date,
    Time#(Time(tstamp,'hh:mm:ss'),'hh:mm:ss') as Time;
LOAD Timestamp#(Timestamp(Now()-Rand()*10,'MM/DD/YYYY hh:mm:ss'),'MM/DD/YYYY hh:mm:ss') as tstamp,
    Round(NORMINV(Rand(),30,5),0.1) as Value
AutoGenerate 50000;

tabCalendar:
LOAD *,
    Day(Date) as Day,
    WeekDay(Date) as WeekDay,
    Week(Date) as Week,
    WeekName(Date) as WeekName,
    Month(Date) as Month,
    MonthName(Date) as MonthName,
    Dual('Q'&Ceil(Month(Date)/3),Ceil(Month(Date)/3)) as Quarter,
    QuarterName(Date) as QuarterName,
    Year(Date) as Year,
    WeekYear(Date) as WeekYear;
LOAD Date(MinDate+IterNo()-1) as Date
While MinDate+IterNo()-1 <= MaxDate;
LOAD Min(Date) as MinDate,
    Max(Date) as MaxDate
Resident table1;

tabTime:
LOAD *,
    Time#(Time(Time,'hh:mm'),'hh:mm') as TimeMin,
    Second(Time) as Second,
    Minute(Time) as Minute,
    Hour(Time) as Hour;
LOAD Time#(Time((RecNo()-1)/86400,'hh:mm:ss'),'hh:mm:ss') as Time
AutoGenerate 86400;
regards
Marco
- Mark as New
- Bookmark
- Subscribe
- Mute
- Subscribe to RSS Feed
- Permalink
- Report Inappropriate Content
or without changing the script, i.e. only using your tstamp field:
hope this helps
regards
Marco
- « Previous Replies
-
- 1
- 2
- Next Replies »