Unlock a world of possibilities! Login now and discover the exclusive benefits awaiting you.
- Qlik Community
- :
- All Forums
- :
- QlikView App Dev
- :
- choosing not to use a dimension
- Subscribe to RSS Feed
- Mark Topic as New
- Mark Topic as Read
- Float this Topic for Current User
- Bookmark
- Subscribe
- Mute
- Printer Friendly Page
- Mark as New
- Bookmark
- Subscribe
- Mute
- Subscribe to RSS Feed
- Permalink
- Report Inappropriate Content
choosing not to use a dimension
Hi I have two dimensions for my chart.
One is Date and the other is for classifying the category into two. I do not think it is important to explain what the other dimension is so I will leave it at this.
so yes, i have two dimensions and I also have two expressions.
one expression is simple count(distinct....)). so it creates two bars for one date interval because expression is first divided by dates and also on top of that classified into two categories by the second dimension.
but in terms of second expression, I want it only to be affected by the date dimension.
Is there any way i can only choose to use one dimension and neglect the second dimension?
I want one reference "like" line that is not divided by any categories but only by dates.
Please help.
Thank you!
- Mark as New
- Bookmark
- Subscribe
- Mute
- Subscribe to RSS Feed
- Permalink
- Report Inappropriate Content
You might be able to use Total <FieldName> qualifier to do this. But the exact usage will have to depend on how you are using this.
- Mark as New
- Bookmark
- Subscribe
- Mute
- Subscribe to RSS Feed
- Permalink
- Report Inappropriate Content
You want to define the aggregation scope of your second expression:
Use the TOTAL qualifier with a field list as Sunny suggested.
What does the TOTAL qualifier do?
So if your Date dimension is based on a field called e.g. OrderDate, the expression might look like
=Sum(TOTAL<OrderDate> Amount)
- Mark as New
- Bookmark
- Subscribe
- Mute
- Subscribe to RSS Feed
- Permalink
- Report Inappropriate Content
Hi Sunny,
Thank you for your response.
I might use
count(distinct(Total < > product_name))
since I want to count the number of products regardless of secondary dimension and only according to date dimension.
but the thing is that the secondary dimension that I created is an calculated dimension. in that case, do you think I can label the calculated dimension and put the name of the calculated dimension between the <> ??
Thanks!
David
- Mark as New
- Bookmark
- Subscribe
- Mute
- Subscribe to RSS Feed
- Permalink
- Report Inappropriate Content
Hi Stefan,
Thank you for your response.
I might use
count(distinct(Total < > product_name))
since I want to count the number of products regardless of secondary dimension and only according to date dimension.
but the thing is that the secondary dimension that I created is an calculated dimension. in that case, do you think I can label the calculated dimension and put the name of the calculated dimension between the <> ??
Thanks!
David
- Mark as New
- Bookmark
- Subscribe
- Mute
- Subscribe to RSS Feed
- Permalink
- Report Inappropriate Content
You will need to group by date, I think
Count(DISTINCT TOTAL <DateField> product_name)
- Mark as New
- Bookmark
- Subscribe
- Mute
- Subscribe to RSS Feed
- Permalink
- Report Inappropriate Content
 Hi Sunny,
Thank you for the help.it worked but the first expression got little fuzzy.

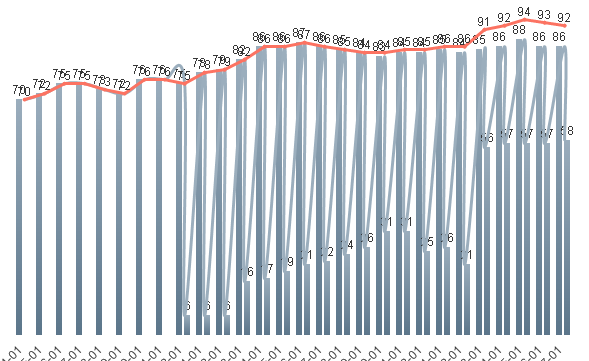
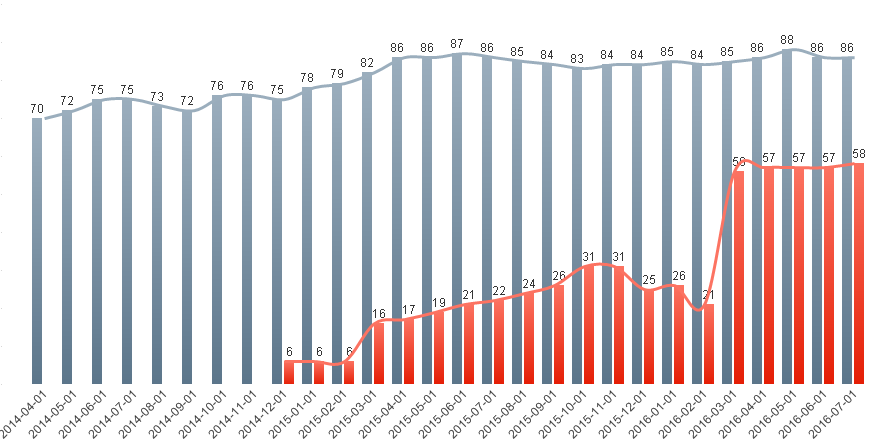
This is how it originally looked like. but once I added the additional expression, it started looking like above.
two bars all of sudden share the same color and the line became meaningless, connecting the two categories.
I just want to add a extra line, which is the red line in the first graph, on top of the second chart.
How can I do this? and why is that crazy phenomenon happening in the first graph?
- Mark as New
- Bookmark
- Subscribe
- Mute
- Subscribe to RSS Feed
- Permalink
- Report Inappropriate Content
I think it might be because since QV is not handling two expressions, it is trying to color code the two expressions by two colors. before I had only one expression so it had its luxury to color code two dimensional grouping by color separating. so I think I want three color code separation when I have two expressions..
- Mark as New
- Bookmark
- Subscribe
- Mute
- Subscribe to RSS Feed
- Permalink
- Report Inappropriate Content
I am not entirely sure what happened here. Difficult for me to comment without looking at it. May be Stefan can offer a solution ![]()
- Mark as New
- Bookmark
- Subscribe
- Mute
- Subscribe to RSS Feed
- Permalink
- Report Inappropriate Content
There are limitations in Qlik using multiple dimensions and expressions, especially using line charts / combo charts.
I think that's what is distorting your line graph.
With regard to the colouring, you can try using the background color attribute expression to create a custom colouring of your bars and lines.