Unlock a world of possibilities! Login now and discover the exclusive benefits awaiting you.
- Qlik Community
- :
- All Forums
- :
- QlikView App Dev
- :
- Re: color in line chart
- Subscribe to RSS Feed
- Mark Topic as New
- Mark Topic as Read
- Float this Topic for Current User
- Bookmark
- Subscribe
- Mute
- Printer Friendly Page
- Mark as New
- Bookmark
- Subscribe
- Mute
- Subscribe to RSS Feed
- Permalink
- Report Inappropriate Content
color in line chart
Hi All,
I am using one line chart in my dashboard. In this chart Emp is a dimension and Sum(Sal) is expression.
Now my requirement is, if my line is increasing then it will show as green line and if it will decreasing then Red color.
please help.
- Tags:
- new_to_qlikview
Accepted Solutions
- Mark as New
- Bookmark
- Subscribe
- Mute
- Subscribe to RSS Feed
- Permalink
- Report Inappropriate Content
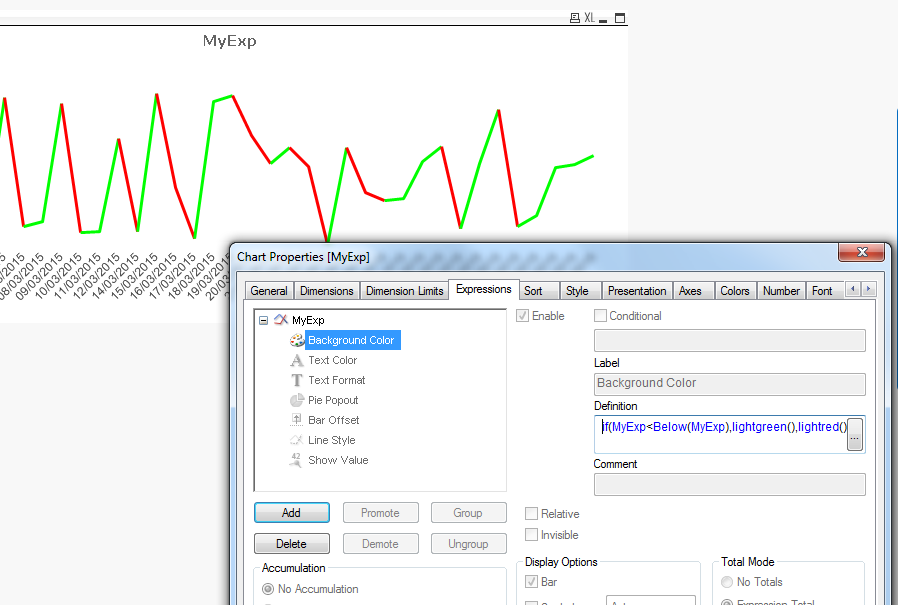
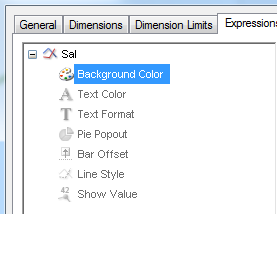
You can use the background color option of your expression (click on the plus sign in front of the expression) and use something like this
if(MyExp<Below(MyExp),lightgreen(),lightred())
Where MyExp is the label of your Sum(Sal) expression, if there are spaces in them put it between [] brackets.
- Mark as New
- Bookmark
- Subscribe
- Mute
- Subscribe to RSS Feed
- Permalink
- Report Inappropriate Content
Hi
Try like this
Background Color:
= if(PreviousSales - CurrentSales > 0, Green(), Red())
Please close the thread by marking correct answer & give likes if you like the post.
- Mark as New
- Bookmark
- Subscribe
- Mute
- Subscribe to RSS Feed
- Permalink
- Report Inappropriate Content
Hi I tried to write
below expression under Background color
=if(Above(Sum(Sal) - Sum(Sal) > 0 , Red(),Green())
but its not working.
- Mark as New
- Bookmark
- Subscribe
- Mute
- Subscribe to RSS Feed
- Permalink
- Report Inappropriate Content
You can use the background color option of your expression (click on the plus sign in front of the expression) and use something like this
if(MyExp<Below(MyExp),lightgreen(),lightred())
Where MyExp is the label of your Sum(Sal) expression, if there are spaces in them put it between [] brackets.
- Mark as New
- Bookmark
- Subscribe
- Mute
- Subscribe to RSS Feed
- Permalink
- Report Inappropriate Content
use this expression:
if(Sal > Below(Sal) , Red(), Green()))
- Mark as New
- Bookmark
- Subscribe
- Mute
- Subscribe to RSS Feed
- Permalink
- Report Inappropriate Content
Hi,
Use
(Sales-Below(Sales)<=0,green(),red())
in background exp, where Sales is the name of the expression.