Unlock a world of possibilities! Login now and discover the exclusive benefits awaiting you.
- Qlik Community
- :
- All Forums
- :
- QlikView App Dev
- :
- Re: columns with percentage values in pivot tables
- Subscribe to RSS Feed
- Mark Topic as New
- Mark Topic as Read
- Float this Topic for Current User
- Bookmark
- Subscribe
- Mute
- Printer Friendly Page
- Mark as New
- Bookmark
- Subscribe
- Mute
- Subscribe to RSS Feed
- Permalink
- Report Inappropriate Content
columns with percentage values in pivot tables
Hi all,
when working with pivot tables,I often liked to add some some columns with percentage values.
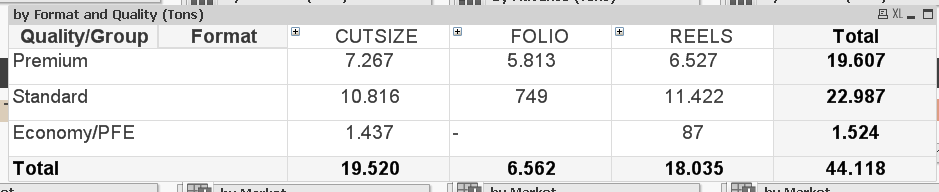
For example, now I have this:
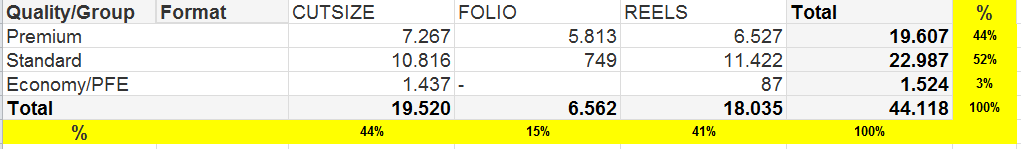
but I would like to have something like this:

Does anyone knows if is it possible?
Thank you!
Sofia Vaz
- « Previous Replies
-
- 1
- 2
- Next Replies »
- Mark as New
- Bookmark
- Subscribe
- Mute
- Subscribe to RSS Feed
- Permalink
- Report Inappropriate Content
Can you elaborate the problem here.
Have you tried adding the expression for %?
- Mark as New
- Bookmark
- Subscribe
- Mute
- Subscribe to RSS Feed
- Permalink
- Report Inappropriate Content
Please share ur app and data, it's possible i think.
- Mark as New
- Bookmark
- Subscribe
- Mute
- Subscribe to RSS Feed
- Permalink
- Report Inappropriate Content
sum(dimension) / sum(total dimension)
Mark the dimesion wtih Show Partial Sums in the Presentation!
- Mark as New
- Bookmark
- Subscribe
- Mute
- Subscribe to RSS Feed
- Permalink
- Report Inappropriate Content
Thank you Shivesh. I'm not able to share app or data...
- Mark as New
- Bookmark
- Subscribe
- Mute
- Subscribe to RSS Feed
- Permalink
- Report Inappropriate Content
Thank you Antonio.
I've add the % expression as a measure. Do you know if there's a way to present the results only for the Total lines? I don't need to present them to for all the cases, as it is now...
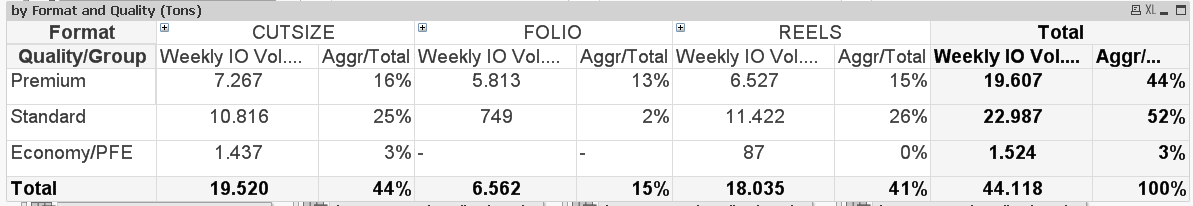
As it is now:

As I would like it to be:

Thank you!
- Mark as New
- Bookmark
- Subscribe
- Mute
- Subscribe to RSS Feed
- Permalink
- Report Inappropriate Content
Hi Chaitanya.
I've add the % expression as a measure. Do you know if there's a way to present the results only for the Total lines? I don't need to present them to for all the cases, as it is now...
As it is now:
As I would like it to be:
Thank you!
- Mark as New
- Bookmark
- Subscribe
- Mute
- Subscribe to RSS Feed
- Permalink
- Report Inappropriate Content
hello
try to use dimensionality()
something like that in your column
if(dimensionality()=1,sum(...),'')
- Mark as New
- Bookmark
- Subscribe
- Mute
- Subscribe to RSS Feed
- Permalink
- Report Inappropriate Content
Hi Olivier,
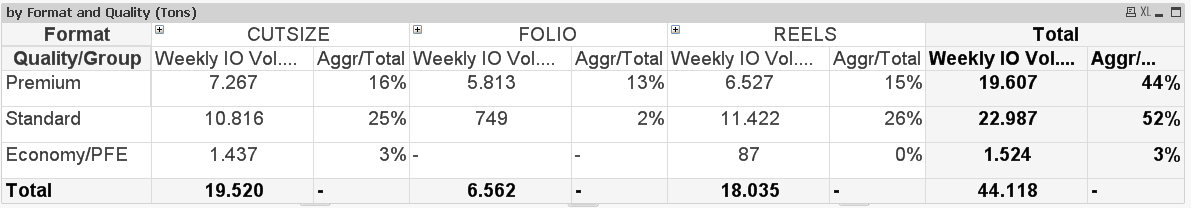
I'd never used dimensionality() before, so I may not understanding this very well.. What I've tried was to change the % expression to this:
if(Dimensionality()=1,(sum({<OrdMasterOrdDateYear={"$(=vYearToday)"},OrdMasterOrdDateWeekYear={$(=vLastOrdMasterOrdDateWeekYear)},OrdItemMillAlloc *={'ATF','FIG','SET'}, OrdItemProdCd={*}-{'SHT'},OrdMasterOrdType={'CUST','STOCK-WHSE'}, OrdItemOrdStat={'CONFIRM','COMPLETE','HOLD'}>}if(OrdItemDelDate<>OrdMasterOrdDate, OrdItemOrdKgs))/1000)/(sum(TOTAL{<OrdMasterOrdDateYear={"$(=vYearToday)"},OrdMasterOrdDateWeekYear={$(=vLastOrdMasterOrdDateWeekYear)},OrdItemMillAlloc *={'ATF','FIG','SET'}, OrdItemProdCd={*}-{'SHT'},OrdMasterOrdType={'CUST','STOCK-WHSE'}, OrdItemOrdStat={'CONFIRM','COMPLETE','HOLD'}>}if(OrdItemDelDate<>OrdMasterOrdDate, OrdItemOrdKgs))/1000
),"")
but the output is this, not exactly what I wanted:
- Mark as New
- Bookmark
- Subscribe
- Mute
- Subscribe to RSS Feed
- Permalink
- Report Inappropriate Content
oups !!! sorry
use secondarydimensionality()
it works the same way but on columns
- « Previous Replies
-
- 1
- 2
- Next Replies »