Unlock a world of possibilities! Login now and discover the exclusive benefits awaiting you.
- Qlik Community
- :
- All Forums
- :
- QlikView App Dev
- :
- Re: conditional display chart problem
- Subscribe to RSS Feed
- Mark Topic as New
- Mark Topic as Read
- Float this Topic for Current User
- Bookmark
- Subscribe
- Mute
- Printer Friendly Page
- Mark as New
- Bookmark
- Subscribe
- Mute
- Subscribe to RSS Feed
- Permalink
- Report Inappropriate Content
conditional display chart problem
Hello,
As the tittle says I want to display a pivot table only if one date from the date listbox is selected.
I searched in qlikcomunity and I found that the solution is the below.
I use a variable Showchart with the expression count(date)
And in the chart(pivot table) properties in the layout tab->Show->Conditional I wrote Showchart=1 .
This doesn't work.
Can anyone suggest why ?
- « Previous Replies
-
- 1
- 2
- Next Replies »
- Mark as New
- Bookmark
- Subscribe
- Mute
- Subscribe to RSS Feed
- Permalink
- Report Inappropriate Content
Hi Kostis,
you probably need $(Showchart) = 1 instead of Showchart is 1. When using the $-sign, the variable will be calculated and will give the result you need.
- Mark as New
- Bookmark
- Subscribe
- Mute
- Subscribe to RSS Feed
- Permalink
- Report Inappropriate Content
Hi,
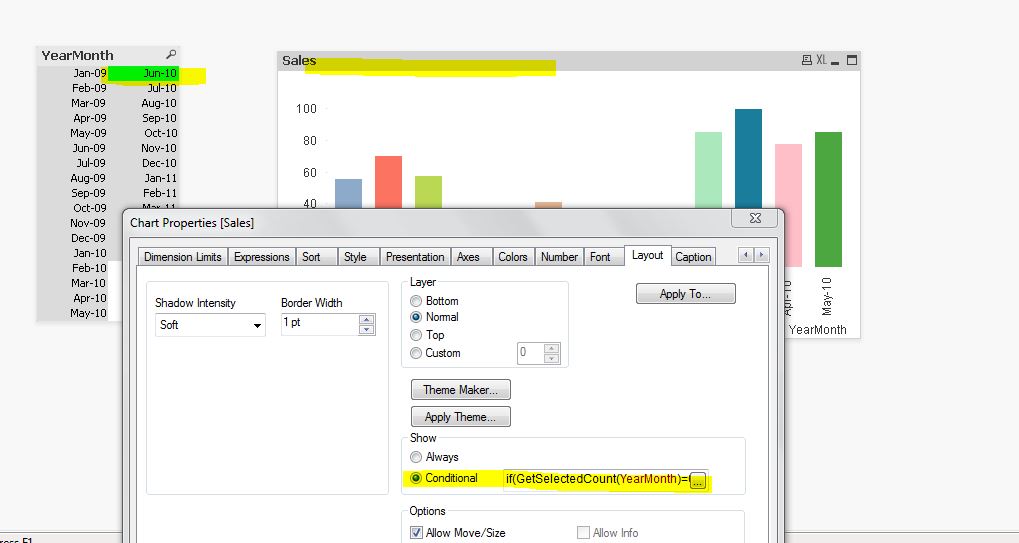
Try like this, refer to the attached sample. tks
if(GetSelectedCount(YearMonth)=0,0,1) // update your field instead of yearmonth
for your case
if(GetSelectedCount(Date)=0,0,1)
- Mark as New
- Bookmark
- Subscribe
- Mute
- Subscribe to RSS Feed
- Permalink
- Report Inappropriate Content
Hello A.M van Keep,
Thank you for your responce.
Unfortunatelly $(Showchart) = 1 doesn't work either.
- Mark as New
- Bookmark
- Subscribe
- Mute
- Subscribe to RSS Feed
- Permalink
- Report Inappropriate Content
Please try with count(distinct date)
- Mark as New
- Bookmark
- Subscribe
- Mute
- Subscribe to RSS Feed
- Permalink
- Report Inappropriate Content
If you have more than 1 counts it won't effect for all rows. I believe DISTINCT keyword is the trick 
- Mark as New
- Bookmark
- Subscribe
- Mute
- Subscribe to RSS Feed
- Permalink
- Report Inappropriate Content
Try writing this expression directly as the conditional expression -> =GetSelectedCount(date)=1
- Mark as New
- Bookmark
- Subscribe
- Mute
- Subscribe to RSS Feed
- Permalink
- Report Inappropriate Content
Hi,
have u tried my suggestion? still issue?
if(GetSelectedCount(Date)=0,0,1)
- Mark as New
- Bookmark
- Subscribe
- Mute
- Subscribe to RSS Feed
- Permalink
- Report Inappropriate Content
In the chart properties under layout add to Show the following statement: GetPossibleCount(date) = 1
- Mark as New
- Bookmark
- Subscribe
- Mute
- Subscribe to RSS Feed
- Permalink
- Report Inappropriate Content
Hi,thank you for your answer ,yes I tried it.It didnt work
- « Previous Replies
-
- 1
- 2
- Next Replies »