Unlock a world of possibilities! Login now and discover the exclusive benefits awaiting you.
- Qlik Community
- :
- All Forums
- :
- QlikView App Dev
- :
- Re: count distinct function in pivot table
- Subscribe to RSS Feed
- Mark Topic as New
- Mark Topic as Read
- Float this Topic for Current User
- Bookmark
- Subscribe
- Mute
- Printer Friendly Page
- Mark as New
- Bookmark
- Subscribe
- Mute
- Subscribe to RSS Feed
- Permalink
- Report Inappropriate Content
count distinct function in pivot table
Dear All,
I have a two columns data serial number and delivery number. Now if we choose one serial number have two same delivery numbers and different delivery number.
Example data want to see in Pivot table:(Requirement)
| Serial No | Delivery Number | Total |
|---|---|---|
| 51 | 801 | 2 |
| 801 | ||
| 51 | 815 | 1 |
| 60 | 950 | 2 |
| 950 | ||
| 60 | 990 | 1 |
| 80 | 1500 | 2 |
| 1500 | ||
| 80 | 2000 | 1 |
The above example table .if we select 51 serial number can see three delivery numbers. But in three delivery numbers have two are same one is different for same serial number.now we need to show this data into pivot chart.
i have tried with this expression in pivot chart:
Aggr( Count(Distinct [Delivery Number]),[Serial No],[Delivery Number])
After expression have data in pivot table:
| Serial No | Delivery Number | Total |
|---|---|---|
| 51 | 801 | 1 |
| 815 | 1 | |
| 60 | 950 | 1 |
| 990 | 1 | |
| 80 | 1500 | 1 |
| 2000 | 1 | |
Please suggest and show the correct expression for my requirement ..
- « Previous Replies
-
- 1
- 2
- Next Replies »
Accepted Solutions
- Mark as New
- Bookmark
- Subscribe
- Mute
- Subscribe to RSS Feed
- Permalink
- Report Inappropriate Content
- Mark as New
- Bookmark
- Subscribe
- Mute
- Subscribe to RSS Feed
- Permalink
- Report Inappropriate Content
Aggr( Count([Delivery Number]),[Serial No],[Delivery Number])
or
Aggr(Count(TOTAL <[Serial No]> [Delivery Number]),[Serial No],[Delivery Number])
- Mark as New
- Bookmark
- Subscribe
- Mute
- Subscribe to RSS Feed
- Permalink
- Report Inappropriate Content
Hi Manish,
Thanks for the quick response...
As suggested, I have applied above expressions.it is not working..
.Total is wrong
now Out put is:
| Serial No | Delivery Number | Total |
|---|---|---|
| 51 | 801 | 16 |
| 815 | 16 | |
| 60 | 950 | 16 |
| 990 | 16 | |
| 80 | 1500 | 16 |
| 2000 | 16 |
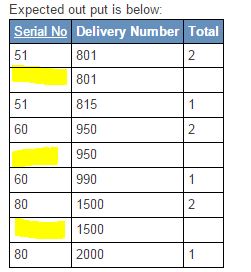
Expected out put is below:
| Serial No | Delivery Number | Total |
|---|---|---|
| 51 | 801 | 2 |
| 801 | ||
| 51 | 815 | 1 |
| 60 | 950 | 2 |
| 950 | ||
| 60 | 990 | 1 |
| 80 | 1500 | 2 |
| 1500 | ||
| 80 | 2000 | 1 |
Please provide correct expression for expected out put..to match my requirement..
- Mark as New
- Bookmark
- Subscribe
- Mute
- Subscribe to RSS Feed
- Permalink
- Report Inappropriate Content
Dear All,
Please provide the correct expression to match the requirement
Thanks
- Mark as New
- Bookmark
- Subscribe
- Mute
- Subscribe to RSS Feed
- Permalink
- Report Inappropriate Content
Do you have Serial No. and Delivery Number as your only two dimensions in the pivot table? What if you just do Count([Delivery Number]) as your expression?
- Mark as New
- Bookmark
- Subscribe
- Mute
- Subscribe to RSS Feed
- Permalink
- Report Inappropriate Content
In pivot table i have two dimensions only. But outside i have sales document and ,company code, actual delivery date has in multi box selection..But in data model i have many fields and it does booking ,billing, delivery and backlog information in different charts.
But here i am just building one pivot chart for the delivery requirement.
Now the requirement had mentioned in original post.
If i select one sales order . i can see 4- serial numbers and 16 Delivery numbers(12 are same 4 has different delivery numbers).
from there after if i select one serial number from 4. I could see 3 delivery numbers that to 2 are same and one has different .
Example of Input Data for Pivot chat:
| Serial No | Delivery Number |
|---|---|
| 51 | 801 |
| 51 | 801 |
| 60 | 801 |
| 60 | 801 |
| 80 | 801 |
| 80 | 801 |
| 90 | 801 |
| 90 | 801 |
| 51 | 666 |
| 60 | 666 |
| 80 | 666 |
| 90 | 666 |
Expected out put for Pivot chart:
| Serial No | Delivery Number | Total |
|---|---|---|
| 51 | 801 | 2 |
| 51 | 666 | 1 |
| 60 | 801 | 2 |
| 60 | 666 | 1 |
| 80 | 801 | 2 |
| 80 | 666 | 1 |
| 90 | 801 | 2 |
| 90 | 666 | 1 |
@sunny T
As per your suggestion. i have used - count(Delivery number) on above example input data.
i could see wrong output as:
| Serial No | Delivery Number | Total |
|---|---|---|
| 51 | 801 | 12 |
| 51 | 666 | 4 |
| 60 | 801 | 12 |
| 60 | 666 | 4 |
| 80 | 801 | 12 |
| 80 | 666 | 4 |
| 90 | 801 | 12 |
| 90 | 666 | 4 |
Please suggest and let me know suitable expression for example input data for pivot chart
- Mark as New
- Bookmark
- Subscribe
- Mute
- Subscribe to RSS Feed
- Permalink
- Report Inappropriate Content
Can you share a qvw sample?
- Mark as New
- Bookmark
- Subscribe
- Mute
- Subscribe to RSS Feed
- Permalink
- Report Inappropriate Content
What about this:
Count(DISTINCT [Delivery Number]
- Mark as New
- Bookmark
- Subscribe
- Mute
- Subscribe to RSS Feed
- Permalink
- Report Inappropriate Content
I think in yur data source, the row below repeat serial No is being interpreted as null values by Qlik. Convert it to populated values and a simple count (delivery number) function should work
- Mark as New
- Bookmark
- Subscribe
- Mute
- Subscribe to RSS Feed
- Permalink
- Report Inappropriate Content
Thank you all , now issue has been resolved.
I have a actual delivery date information in data model.so I have added to pivot table and applied expression as Count(DISTINCT [actual delivery date]).
- « Previous Replies
-
- 1
- 2
- Next Replies »