Unlock a world of possibilities! Login now and discover the exclusive benefits awaiting you.
- Qlik Community
- :
- All Forums
- :
- QlikView App Dev
- :
- Re: count if date >= AND <= than value
- Subscribe to RSS Feed
- Mark Topic as New
- Mark Topic as Read
- Float this Topic for Current User
- Bookmark
- Subscribe
- Mute
- Printer Friendly Page
- Mark as New
- Bookmark
- Subscribe
- Mute
- Subscribe to RSS Feed
- Permalink
- Report Inappropriate Content
count if date >= AND <= than value
Hey folks,
I have a question concerning dates.
I have the following table: two dimensions (type and shop)
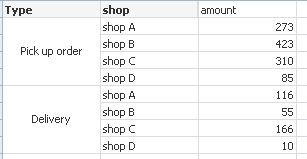
"Amount" shows the amount of deliveries/pick up's. You find the value "amount" with the following expression:
=(Count({$<Ordernr={'40*', '9*'}>}DISTINCT Ordernr))
Ordernr is the code a delivery/pick up gets. So it just counts the number of codes starting with 40* or 9* (pick up and delivery).
BUT: I now need the amount of deliveries/pick up's for a specific month. The date can be found in the dimension "date" (DD/MM/YYYY)
How can I tell Qlikview which month it needs to take into consideration?
something like
if( date >= 01/04/2013 AND <=30/04/2013, Count({$<Ordernr={'40*', '9*'}>}DISTINCT Ordernr)))
But it does not show me any values..
So I should be able to count the amount of orders in a specific month. The "date" can not be selected as a value, cus I need to be able to count it for different months in different expressions.
Who can help me please?
Thanks alot!
Zipke
- « Previous Replies
-
- 1
- 2
- Next Replies »
Accepted Solutions
- Mark as New
- Bookmark
- Subscribe
- Mute
- Subscribe to RSS Feed
- Permalink
- Report Inappropriate Content
Hi Zipke,
Use this set analysis and let me know the result
Count({$<Ordernr={'40*', '9*'}, date = {">=01/04/2013<=30/04/2013"}>} DISTINCT Ordernr)
Regards,
Sokkorn
- Mark as New
- Bookmark
- Subscribe
- Mute
- Subscribe to RSS Feed
- Permalink
- Report Inappropriate Content
if( date >= 01/04/2013 and date <=30/04/2013, Count({$<Ordernr={'40*', '9*'}>}DISTINCT Ordernr))
- Mark as New
- Bookmark
- Subscribe
- Mute
- Subscribe to RSS Feed
- Permalink
- Report Inappropriate Content
Hi Zipke,
Use this set analysis and let me know the result
Count({$<Ordernr={'40*', '9*'}, date = {">=01/04/2013<=30/04/2013"}>} DISTINCT Ordernr)
Regards,
Sokkorn
- Mark as New
- Bookmark
- Subscribe
- Mute
- Subscribe to RSS Feed
- Permalink
- Report Inappropriate Content
Use set analysis but make your live easier:
create time dimensions:
Year(orderdate)
month(orderdate)
week(orderdate)
and so on.
Then just use the simple expression count(distinct ordernr) and select a month, year or week combination you want. Also you can just set the set analysis to the right monthnmbr:
Count({$<Ordernr={'40*', '9*'}, month = {'4'}>} DISTINCT Ordernr) or
Count({$<Ordernr={'40*', '9*'}, month = {"=$(vMonthNumber)"}>} DISTINCT Ordernr)
- Mark as New
- Bookmark
- Subscribe
- Mute
- Subscribe to RSS Feed
- Permalink
- Report Inappropriate Content
try this
=Count({$<Ordernr = p({$<date ={">= 01/04/2013<=30/04/2013"},Ordernr={'40*','9*'}>}Ordernr)>} DISTINCT Ordernr)
******************************************************************************************************************
or try this
=Count({$<Ordernr = p({$<date ={">= 01/04/2013<=30/04/2013"},Ordernr={'40*','9*'}>})>} DISTINCT Ordernr)
- Mark as New
- Bookmark
- Subscribe
- Mute
- Subscribe to RSS Feed
- Permalink
- Report Inappropriate Content
Thanks already for the replies.
I am checking the results, since some of them give me different numbers..
I have one last question though, the date is nog in DD/MM/YYYY. I changed it in my chart to number>date, but when I do not do this, it just gives me the standard numbers eg. 01/01/2013 = 46523
Does this change somehting to the expression I need to use?
Cheers,
Zipke
- Mark as New
- Bookmark
- Subscribe
- Mute
- Subscribe to RSS Feed
- Permalink
- Report Inappropriate Content
Try this
Count( {$<date ={"$(='>=' & Date#('01/04/2013','DD/MM/YYYY') & '<='& Date#('30/04/2013','DD/MM/YYYY'))"} ,Ordernr={'40*', '9*'} >}DISTINCT Ordernr)
- Mark as New
- Bookmark
- Subscribe
- Mute
- Subscribe to RSS Feed
- Permalink
- Report Inappropriate Content
if you change the date format in number then write
num(datefield) or num(date('01/04/2013'))
IF you change the num in date then write this
date(datefield) or date('01/04/2013')
if your problem resolved then marked it as either correct or helpful according to your question so that it might be helpful for other developer
Regards
vishwaranjan
- Mark as New
- Bookmark
- Subscribe
- Mute
- Subscribe to RSS Feed
- Permalink
- Report Inappropriate Content
Thank you vishwaranjan,
I have been trying all the options.
And I will mark a reply as correct or helpful, don't worry, but only once I am 100% sure it is correct. It gives me values that I did not expect, so I have to check the results first, but did not have the time yet.
Cheers,
Zipke
- Mark as New
- Bookmark
- Subscribe
- Mute
- Subscribe to RSS Feed
- Permalink
- Report Inappropriate Content
Thanks to all for the reactions.
The expressions of Sokkorn and er.mohit were the correct ones.
Vishwaranjan, thanks to you too. For some reason it did not work for 100%, so I prefere to use the other ones.
Cheers for the quick replies!
Zipke
- « Previous Replies
-
- 1
- 2
- Next Replies »