Unlock a world of possibilities! Login now and discover the exclusive benefits awaiting you.
- Qlik Community
- :
- All Forums
- :
- QlikView App Dev
- :
- Re: count of results
- Subscribe to RSS Feed
- Mark Topic as New
- Mark Topic as Read
- Float this Topic for Current User
- Bookmark
- Subscribe
- Mute
- Printer Friendly Page
- Mark as New
- Bookmark
- Subscribe
- Mute
- Subscribe to RSS Feed
- Permalink
- Report Inappropriate Content
count of results
Hi all,
This is an easy one i'm sure but i cannot get it to work.
basically i have the following expression in a straight table with 'Name' as a dimension which gives the below result..
if(avg({<[Source_File_Name]={'Test'}, Date={'>=$(=date(vPreviousMonthStart))<=$(=date(vPreviousMonthEnd))'}>}%Change)>=$(vKPIThreshold),
avg({<Source_File_Name={'Test'}, Date={'>=$(=date(vPreviousMonthStart))<=$(=date(vPreviousMonthEnd))'}>}%Change),0)
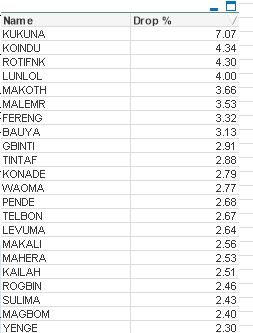
there is a total of 47 rows in the above table.
what i want to do now is get a count of the rows in a text box, so i just want a text box that shows 47.
can anyone help?
Accepted Solutions
- Mark as New
- Bookmark
- Subscribe
- Mute
- Subscribe to RSS Feed
- Permalink
- Report Inappropriate Content
May be this
Sum(Aggr(If(Avg({<[Source_File_Name]={'Test'}, Date={'>=$(=date(vPreviousMonthStart))<=$(=date(vPreviousMonthEnd))'}>}%Change)>=$(vKPIThreshold),1, 0), Name))
- Mark as New
- Bookmark
- Subscribe
- Mute
- Subscribe to RSS Feed
- Permalink
- Report Inappropriate Content
May be this
Sum(Aggr(If(Avg({<[Source_File_Name]={'Test'}, Date={'>=$(=date(vPreviousMonthStart))<=$(=date(vPreviousMonthEnd))'}>}%Change)>=$(vKPIThreshold),1, 0), Name))
- Mark as New
- Bookmark
- Subscribe
- Mute
- Subscribe to RSS Feed
- Permalink
- Report Inappropriate Content
Thanks Sunny!