Unlock a world of possibilities! Login now and discover the exclusive benefits awaiting you.
- Qlik Community
- :
- All Forums
- :
- QlikView App Dev
- :
- create a flag field
- Subscribe to RSS Feed
- Mark Topic as New
- Mark Topic as Read
- Float this Topic for Current User
- Bookmark
- Subscribe
- Mute
- Printer Friendly Page
- Mark as New
- Bookmark
- Subscribe
- Mute
- Subscribe to RSS Feed
- Permalink
- Report Inappropriate Content
create a flag field
Hi,
How can I show the month dimension, so for each month it will show the last 6 months relative to current month dimension?
For each one of the relations, how can I set a flag field = 1 when the Transaction Month falls in the required period compared to the Display Month.
For example:
Trans. Month Display Month Last6Months
Jan Jul 0
Feb Jul 1
Mar Jul 1
Apr Jul 1
May Jul 1
Jun Jul 1
Jul Jul 1
please, help in creating the flag field and then based on my flag field I have to perform some calculations
and how can I use a technique "as of date" and build a link table in the script.
Please,help with some sample script!!
Thanks,
Rohit
- Mark as New
- Bookmark
- Subscribe
- Mute
- Subscribe to RSS Feed
- Permalink
- Report Inappropriate Content
The problem here is that you can't simply use a flag based on the selected month dimension, as every month will have a last 6 month flag!
If you search on here for "point in time" then you will find some good ideas such as:
Calendar with AsOf Flags, Compare Easter to Easter
For simple set analysis you can use something like:
sum({<Date={'>$(=AddMonths(Max(Date),-6))'}>}>}yourfield)
- Mark as New
- Bookmark
- Subscribe
- Mute
- Subscribe to RSS Feed
- Permalink
- Report Inappropriate Content
Hi Adam,
We have tried with below expression as well but it is not giving expected result.
sum({<Date={'>$(=AddMonths(Max(Date),-6))'}>}>}yourfield)
Could you please share some sample qvw to have some understanding.
Thanks,
Rohit
- Mark as New
- Bookmark
- Subscribe
- Mute
- Subscribe to RSS Feed
- Permalink
- Report Inappropriate Content
Hi Rohit,
If you can share a small sample of your data, or some dummy data then I'll knock up a formula for you
Kind regards
Adam
- Mark as New
- Bookmark
- Subscribe
- Mute
- Subscribe to RSS Feed
- Permalink
- Report Inappropriate Content
Hi Adam,
Sorry for the late reply.
Please find attached file which is having sample data.
| Customer ID | Transaction Date | Sales Qty | Country Code |
| 10 | 15-Jan-16 | 1 | US |
| 11 | 15-Jan-16 | 2 | US |
| 12 | 15-Jan-16 | 3 | UK |
| 13 | 15-Feb-16 | 2 | IR |
| 15 | 15-Feb-16 | 3 | US |
| 16 | 15-Feb-16 | 5 | US |
| 17 | 15-Mar-16 | 2 | UK |
| 18 | 15-Mar-16 | 6 | IR |
| 19 | 15-Mar-16 | 7 | US |
| 20 | 15-Mar-16 | 8 | US |
| 21 | 15-Apr-16 | 1 | UK |
| 22 | 15-Apr-16 | 4 | IR |
| 23 | 15-Apr-16 | 5 | US |
| 24 | 15-Apr-16 | 6 | US |
| 25 | 15-Apr-16 | 3 | UK |
| 26 | 15-May-16 | 1 | IR |
| 27 | 15-May-16 | 2 | US |
| 28 | 15-May-16 | 3 | US |
| 29 | 15-Jun-16 | 2 | UK |
| 30 | 15-Jun-16 | 3 | IR |
| 31 | 15-Jun-16 | 5 | US |
| 32 | 15-Jul-16 | 2 | US |
| 33 | 15-Jul-16 | 6 | UK |
| 34 | 15-Jul-16 | 7 | IR |
| 35 | 15-Jul-16 | 8 | US |
| 36 | 15-Aug-16 | 1 | US |
| 37 | 15-Aug-16 | 4 | UK |
| 38 | 15-Aug-16 | 5 | IR |
| 39 | 15-Aug-16 | 6 | US |
| 40 | 15-Aug-16 | 3 | US |
| 41 | 15-Sep-16 | 4 | UK |
| 42 | 15-Sep-16 | 5 | IR |
| 43 | 15-Sep-16 | 6 | US |
| 44 | 15-Oct-16 | 3 | US |
| 45 | 15-Oct-16 | 1 | UK |
| 46 | 15-Oct-16 | 2 | IR |
| 47 | 15-Oct-16 | 3 | US |
| 48 | 15-Nov-16 | 2 | US |
| 49 | 15-Nov-16 | 3 | UK |
| 50 | 15-Nov-16 | 5 | IR |
| 51 | 15-Nov-16 | 2 | US |
| 52 | 15-Nov-16 | 6 | US |
| 53 | 15-Nov-16 | 7 | UK |
| 54 | 15-Nov-16 | 8 | IR |
| 55 | 15-Dec-16 | 1 | US |
| 56 | 15-Dec-16 | 4 | US |
| 57 | 15-Dec-16 | 5 | UK |
| 58 | 15-Dec-16 | 6 | IR |
| 59 | 15-Dec-16 | 3 | US |
I want to know more about creating the flag field.
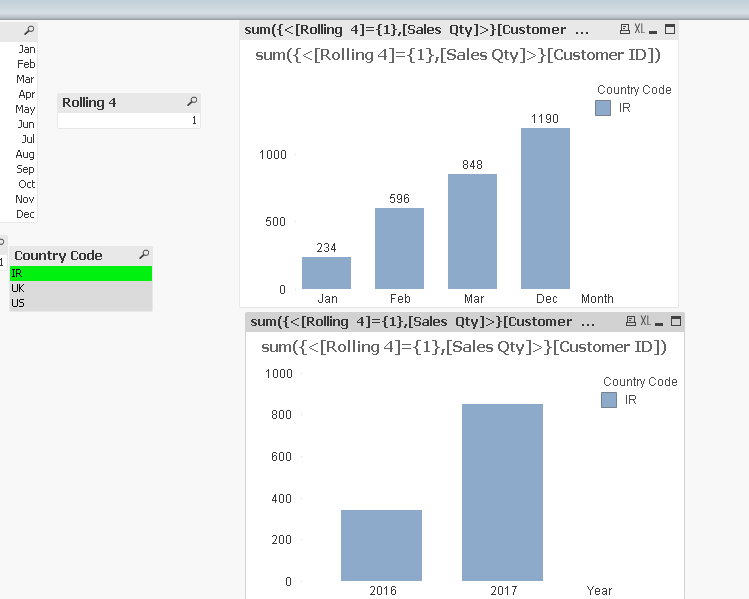
Also , if the current selection month is Apr so it is showing data for rolling last 4 month accumulative value i.e Jan,Feb,Mar and Apr, and a single bar need to be displayed for all four month in bar chart.
Similarly if we want to display rolling 1 year data in bar chart than it should display three bars, in which each bar represent accumulated value of four months.
- Mark as New
- Bookmark
- Subscribe
- Mute
- Subscribe to RSS Feed
- Permalink
- Report Inappropriate Content
I'm not sure if this is what you looking for...
Find the attachment.
I've to alter your data as your data couldn't show last 3 months from today as it will end in Dec 2016 and cannot go rolling 4 before Dec-2016...I guess you understand it.
I used below expression
sum({<[Rolling 4]={1},[Sales Qty]>}[Customer ID])
- Mark as New
- Bookmark
- Subscribe
- Mute
- Subscribe to RSS Feed
- Permalink
- Report Inappropriate Content
Hi Aehman,
Could you please provide more information on how the sum data has been calculated with below expression:
sum({<[Sales Qty],[Rolling 4]>}[Customer ID])
Also, could you please let me know any idea on creating the flag field. If you could share some sample QVW that would be helpful to analyze the issue.

- Mark as New
- Bookmark
- Subscribe
- Mute
- Subscribe to RSS Feed
- Permalink
- Report Inappropriate Content
The expression is sum({<[Sales Qty],[Rolling 4]={1}>}[Customer ID])
Not sum({<[Sales Qty],[Rolling 4]>}[Customer ID])
The exp will calculate sales for only previous 4 months where the flag is 1 from Customer ID.
and to create flags, check the script for the QVW I provided you in previous mail...
Check for MC Tab, (Master Calendar)