Unlock a world of possibilities! Login now and discover the exclusive benefits awaiting you.
- Qlik Community
- :
- All Forums
- :
- QlikView App Dev
- :
- Re: create calculated dimension based on measure
- Subscribe to RSS Feed
- Mark Topic as New
- Mark Topic as Read
- Float this Topic for Current User
- Bookmark
- Subscribe
- Mute
- Printer Friendly Page
- Mark as New
- Bookmark
- Subscribe
- Mute
- Subscribe to RSS Feed
- Permalink
- Report Inappropriate Content
create calculated dimension based on measure
hi,
I have the following table
load * inline [
Store, sale
1, 10
2, 20
3, 30
4, 40
5, 50
6, 60
7, 70
8, 80
9, 90
];
I need to create a dimension on a table on UI (dont want to make changes on script) to show buckets of sales as follow
if(sum(sale)/ sum(total sale)<0.01, 'Image1',
if(sum(sale)/ sum(total sale)<0.03, 'Image2',
if(sum(sale)/ sum(total sale)<0.07, 'Image3', 'Image4')))
anyone has a sample?
Best,
Alec
- Mark as New
- Bookmark
- Subscribe
- Mute
- Subscribe to RSS Feed
- Permalink
- Report Inappropriate Content
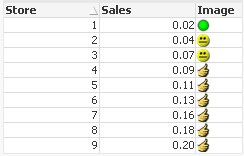
Here you go
Expression i used
if(Num(sum(sale)/ sum(total sale),'#,##0.00')<0.01, 'qmem://<bundled>/BuiltIn/arrow_s_g.png',
if(Num(sum(sale)/ sum(total sale),'#,##0.00')<0.03, 'qmem://<bundled>/BuiltIn/led_g.png',
if(Num(sum(sale)/ sum(total sale),'#,##0.00')<0.07, 'qmem://<bundled>/BuiltIn/smiley2_y.png', 'qmem://<bundled>/BuiltIn/thumb2.png')))
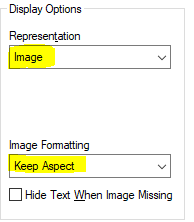
And Then Make it represent as image and Format
Output
- Mark as New
- Bookmark
- Subscribe
- Mute
- Subscribe to RSS Feed
- Permalink
- Report Inappropriate Content
very close but not what I am looking for.
my final table would be as follow if I take the numbers from yours.
Sales, Image
0.02, Image 1
0.07, Image 2
0.20, Image 3
- Mark as New
- Bookmark
- Subscribe
- Mute
- Subscribe to RSS Feed
- Permalink
- Report Inappropriate Content
Your original Question answer would be this? But now you are expecting different way
Question to you are you looking Max sales from Image(Expression) of each aggregation.
I am not sure, I followed you. Try a shot. I even wonder, How you need. May be explain logic if you thinks different
FirstSortedValue(Column(1), -Aggr(Column(1), Column(2))
- Mark as New
- Bookmark
- Subscribe
- Mute
- Subscribe to RSS Feed
- Permalink
- Report Inappropriate Content
Hi,
Try this one as
Dim:-
=if(aggr(sum(sale)/ sum(total sale),Store)<0.01, 'Image1',
if(aggr(sum(sale)/ sum(total sale),Store)<0.03, 'Image2',
if(aggr(sum(sale)/ sum(total sale),Store)<0.07, 'Image3', 'Image4')))
Exp:-
sum(sale)/ sum(total sale)
Regards,
- Mark as New
- Bookmark
- Subscribe
- Mute
- Subscribe to RSS Feed
- Permalink
- Report Inappropriate Content
Hi Alec,
Try this:
Make a straight table with this calculated dimension:
=Aggr(
Pick(
match(-1,
sum(sale)/sum(TOTAL sale)<0.01,
sum(sale)/sum(TOTAL sale)<0.03,
sum(sale)/sum(TOTAL sale)<0.07,
-1),'Image 1','Image 2','Image 3','Image 4')
,Store)
Add this expression:
=Aggr(
Pick(
match(-1,
sum(sale)/sum(TOTAL sale)<0.01,
sum(sale)/sum(TOTAL sale)<0.03,
sum(sale)/sum(TOTAL sale)<0.07,
-1),
Path to Image1,
Path to Image2,
Path to Image3,
Path to Image4)
,Store)
Let's add a simple expression:
count(Store)
In the presentation tab hide the first column.
Now click on the expression column with the symbols as if it was a dimension column.
Cheers
Andrew
- Mark as New
- Bookmark
- Subscribe
- Mute
- Subscribe to RSS Feed
- Permalink
- Report Inappropriate Content
May be Try the dimension as
=If(Round(Aggr(sum(sale),Store)/ sum(Total sale),0.01) < 0.01, 'Image1',
If(Round(Aggr(sum(sale),Store)/ sum(Total sale),0.01) < 0.03,'Image2',
if(Round(Aggr(sum(sale),Store)/ sum(Total sale),0.01) < 0.07,'Image3','Image4'
)))
- Mark as New
- Bookmark
- Subscribe
- Mute
- Subscribe to RSS Feed
- Permalink
- Report Inappropriate Content
none of the solutions worked.. anyone has a qvw with the solution on it?
thank you