Unlock a world of possibilities! Login now and discover the exclusive benefits awaiting you.
- Qlik Community
- :
- All Forums
- :
- QlikView App Dev
- :
- Re: create legend with trendline
- Subscribe to RSS Feed
- Mark Topic as New
- Mark Topic as Read
- Float this Topic for Current User
- Bookmark
- Subscribe
- Mute
- Printer Friendly Page
- Mark as New
- Bookmark
- Subscribe
- Mute
- Subscribe to RSS Feed
- Permalink
- Report Inappropriate Content
create legend with trendline
Hey,
I would like to add a legend to my line chart, which consists of a time series and its trend.
Could you help me with this issue?
Many thanks in advance!
- « Previous Replies
-
- 1
- 2
- Next Replies »
Accepted Solutions
- Mark as New
- Bookmark
- Subscribe
- Mute
- Subscribe to RSS Feed
- Permalink
- Report Inappropriate Content
I just added textboxes and grouped them with the linechart.
That solution works for me just fine.
Thanks anyway!
- Mark as New
- Bookmark
- Subscribe
- Mute
- Subscribe to RSS Feed
- Permalink
- Report Inappropriate Content
You posted this question in the wrong forum.
Could you tell us if you are asking this for QlikView or Qlik Sense, so we can move it to a more fitting forum?
- Mark as New
- Bookmark
- Subscribe
- Mute
- Subscribe to RSS Feed
- Permalink
- Report Inappropriate Content
My question refers to QlikView.
Thank you for moving my question to the right forum!
- Mark as New
- Bookmark
- Subscribe
- Mute
- Subscribe to RSS Feed
- Permalink
- Report Inappropriate Content
- Mark as New
- Bookmark
- Subscribe
- Mute
- Subscribe to RSS Feed
- Permalink
- Report Inappropriate Content
Can you try this Expression:
The expression below needs to be used and calculated as a new measure
linest_m(total aggr(if(sum(Sales),sum(Sales)),OrderDate),OrderDate)* only({1}OrderDate)+linest_b(total aggr(if(sum(Sales),sum(Sales)),OrderDate),OrderDate)
Or may be some other extensions.
- Mark as New
- Bookmark
- Subscribe
- Mute
- Subscribe to RSS Feed
- Permalink
- Report Inappropriate Content
My trend line is not linear, its a polynom.
I tried to implement the trend line as a new measure.
Unfortunately, it didn't work.
- Mark as New
- Bookmark
- Subscribe
- Mute
- Subscribe to RSS Feed
- Permalink
- Report Inappropriate Content
I just added textboxes and grouped them with the linechart.
That solution works for me just fine.
Thanks anyway!
- Mark as New
- Bookmark
- Subscribe
- Mute
- Subscribe to RSS Feed
- Permalink
- Report Inappropriate Content
see attached file
hope this helps
- Mark as New
- Bookmark
- Subscribe
- Mute
- Subscribe to RSS Feed
- Permalink
- Report Inappropriate Content
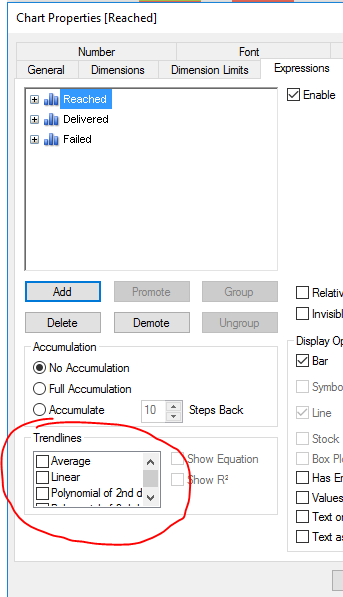
Why you don't check the Trendline option?
- Mark as New
- Bookmark
- Subscribe
- Mute
- Subscribe to RSS Feed
- Permalink
- Report Inappropriate Content
Thats what I did.
But the question was how to add a legend to the linechart, where it says blue is for gdp and red for the trendline. Only GDP is displayed in the linechart.
- « Previous Replies
-
- 1
- 2
- Next Replies »