Unlock a world of possibilities! Login now and discover the exclusive benefits awaiting you.
- Qlik Community
- :
- All Forums
- :
- QlikView App Dev
- :
- Re: daily monitoring
- Subscribe to RSS Feed
- Mark Topic as New
- Mark Topic as Read
- Float this Topic for Current User
- Bookmark
- Subscribe
- Mute
- Printer Friendly Page
- Mark as New
- Bookmark
- Subscribe
- Mute
- Subscribe to RSS Feed
- Permalink
- Report Inappropriate Content
daily monitoring
Hello lovely people,
I need to create a graph that contains the daily evolution of an indicato. Here's what I did :
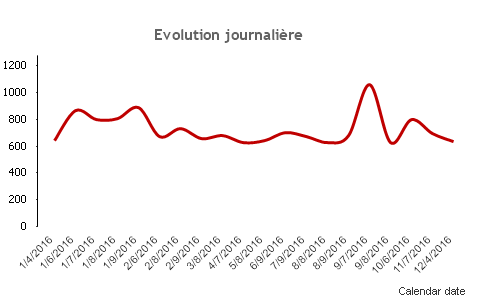
The problem is that on my graph I wanna display the 5 maximum dates : 15,14,13 sep ect..
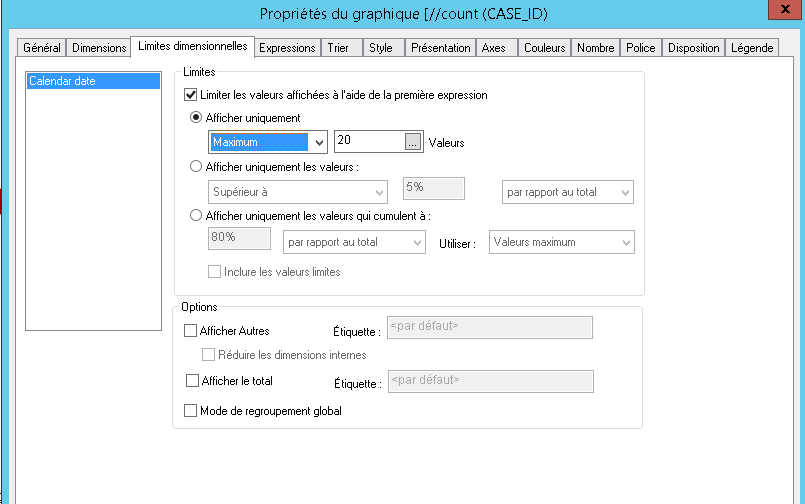
Bellow the graph properties :
Any idea please?
Thanks
- Mark as New
- Bookmark
- Subscribe
- Mute
- Subscribe to RSS Feed
- Permalink
- Report Inappropriate Content
May be use set analysis to display 5 max date instead of dimension limits
- Mark as New
- Bookmark
- Subscribe
- Mute
- Subscribe to RSS Feed
- Permalink
- Report Inappropriate Content
An example please.
- Mark as New
- Bookmark
- Subscribe
- Mute
- Subscribe to RSS Feed
- Permalink
- Report Inappropriate Content
Hi Wiem,

And don't show others:

Regards!
- Mark as New
- Bookmark
- Subscribe
- Mute
- Subscribe to RSS Feed
- Permalink
- Report Inappropriate Content
hi,
like sunny say use set analysis, something like this :
variables :
vDateDeb = Date(Max(DATE)-5,'DD/MM/YYYY')
vDateFin = Date(Max(DATE),'DD/MM/YYYY')
nb : use the format of DATE (here date is formated 'DD/MM/YYYY')
Set Analysis:
DATE={'>=$(vDateDeb ) <=$(vDateFin )'}
- Mark as New
- Bookmark
- Subscribe
- Mute
- Subscribe to RSS Feed
- Permalink
- Report Inappropriate Content
Hi Sunny, what happens if the dates are not consecutive?,
Max Date = '15/09/2016'
Last 5 dates:
01/09/2016, 03/09/2016, 05/09/2016, 08/09/2016, 15/09/2016
You will show only 2 dates, not 5. This is a case for limit dims.
Regards!
- Mark as New
- Bookmark
- Subscribe
- Mute
- Subscribe to RSS Feed
- Permalink
- Report Inappropriate Content
Hello Manuel, this is what I did and the result doesn't work as you can see bellow.
Thanks
- Mark as New
- Bookmark
- Subscribe
- Mute
- Subscribe to RSS Feed
- Permalink
- Report Inappropriate Content
May be something like this:
Sum({<Date = {"$(='>=' & Date(Max({<Date = {'<=$(=Date(Max(Date)))'}>}Date, 5)) & '<=' & Date(Max(Date)))"}>}Measure)
Make sure that date is created as this in the script:
LOAD Date(Date) as Date,
...
FROM ....
- Mark as New
- Bookmark
- Subscribe
- Mute
- Subscribe to RSS Feed
- Permalink
- Report Inappropriate Content
Try this then: =Sum({<Date={'>=$(=Date(FirstSortedValue(Date,-Date,5)))'}>}Value)
Regards!