Unlock a world of possibilities! Login now and discover the exclusive benefits awaiting you.
- Qlik Community
- :
- All Forums
- :
- QlikView App Dev
- :
- Re: designing this kind of charts is Possible in Q...
- Subscribe to RSS Feed
- Mark Topic as New
- Mark Topic as Read
- Float this Topic for Current User
- Bookmark
- Subscribe
- Mute
- Printer Friendly Page
- Mark as New
- Bookmark
- Subscribe
- Mute
- Subscribe to RSS Feed
- Permalink
- Report Inappropriate Content
designing this kind of charts is Possible in Qlikview ???
we are facing Problem with the bar chart scale , using one dimension Monthyear and 2 Expressions Source count and target count.
And the chat has to display the months in Rolling Months i.e it will display current months counts along with the last 2 months counts.
now the issue is few values are in hundreds where as few values are in millions for the same Expression.
the bar which is in hundreds is almost laying on the Y axis.
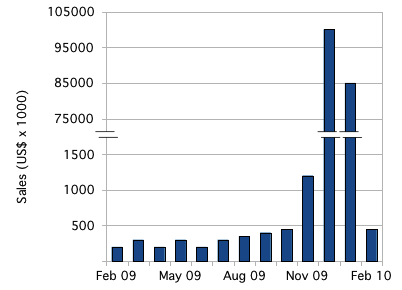 Above Image can fulfill our Requirements , is it possible to create this kind of charts in Qlikview..
If yes please Respond with work around..
it will be great if some one Provide the solution.
- Mark as New
- Bookmark
- Subscribe
- Mute
- Subscribe to RSS Feed
- Permalink
- Report Inappropriate Content
On the Chart Properties | Axes tab, you you try ticking Log Scale.
Not actually what you request, but may well suffice.
- Mark as New
- Bookmark
- Subscribe
- Mute
- Subscribe to RSS Feed
- Permalink
- Report Inappropriate Content
Hi Bill ,
Thanks for the Quick reply , but we are not allowed to uncheck the forced 0.
Any other method to do this.
Best Regards,
V.
- Mark as New
- Bookmark
- Subscribe
- Mute
- Subscribe to RSS Feed
- Permalink
- Report Inappropriate Content
In that case, if I was you, I'd pass the problem onto whoever says you are not allowed to uncheck the forced 0.
Then they can either :
- Relax their stipulation
- Find a suitable solution
- Explain to your End Users why the chart is made useless as a consequence of their stipulation
- Mark as New
- Bookmark
- Subscribe
- Mute
- Subscribe to RSS Feed
- Permalink
- Report Inappropriate Content
Hi Bill ,
Yeah if it is Not possible with Forced 0 option,
then I have to do the same as what you do if you were in My position.
Thanks for the Information , found a Simple way to show them the value of the Bar.
I will give fast change option ( a straight table) and inform them to select it if they want to view the values.
this is better right in this situation. ?