Unlock a world of possibilities! Login now and discover the exclusive benefits awaiting you.
- Qlik Community
- :
- All Forums
- :
- QlikView App Dev
- :
- display all month days on a chart
- Subscribe to RSS Feed
- Mark Topic as New
- Mark Topic as Read
- Float this Topic for Current User
- Bookmark
- Subscribe
- Mute
- Printer Friendly Page
- Mark as New
- Bookmark
- Subscribe
- Mute
- Subscribe to RSS Feed
- Permalink
- Report Inappropriate Content
display all month days on a chart
Hi everyone,
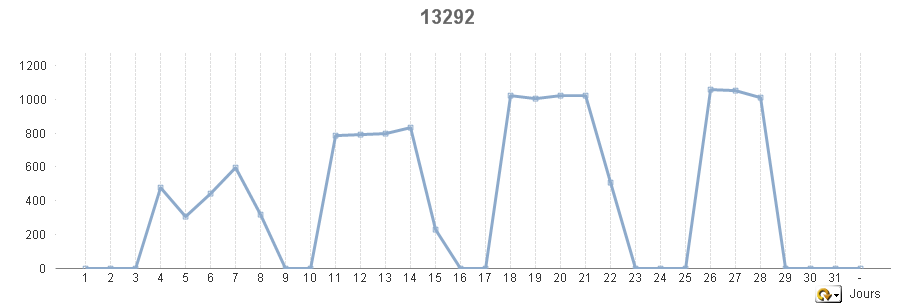
in the image below i want to display also days with no sales for exemple : day 1,2,3,9,...
my expression is : sum (sales)
Accepted Solutions
- Mark as New
- Bookmark
- Subscribe
- Mute
- Subscribe to RSS Feed
- Permalink
- Report Inappropriate Content
Just above 'Show All Values', there is 'Supress When Value Is Null', check that option.
- Mark as New
- Bookmark
- Subscribe
- Mute
- Subscribe to RSS Feed
- Permalink
- Report Inappropriate Content
On presentation uncheck the supress zero values option
- Mark as New
- Bookmark
- Subscribe
- Mute
- Subscribe to RSS Feed
- Permalink
- Report Inappropriate Content
On chart Properties >> Presentation >> Uncheck the Supress Zero Values
- Mark as New
- Bookmark
- Subscribe
- Mute
- Subscribe to RSS Feed
- Permalink
- Report Inappropriate Content
i already tried this but not working, then i tried to check show all values on my dimension it's works but i'm getting the '-' sign after the day 31 any idea how to remove it

- Mark as New
- Bookmark
- Subscribe
- Mute
- Subscribe to RSS Feed
- Permalink
- Report Inappropriate Content
To remove '-' sign,
Properties --> Dimension --> Check "Suppress When Value Is Null"
- Mark as New
- Bookmark
- Subscribe
- Mute
- Subscribe to RSS Feed
- Permalink
- Report Inappropriate Content
Just above 'Show All Values', there is 'Supress When Value Is Null', check that option.
- Mark as New
- Bookmark
- Subscribe
- Mute
- Subscribe to RSS Feed
- Permalink
- Report Inappropriate Content
haven't see it lol
thanks for your help
- Mark as New
- Bookmark
- Subscribe
- Mute
- Subscribe to RSS Feed
- Permalink
- Report Inappropriate Content
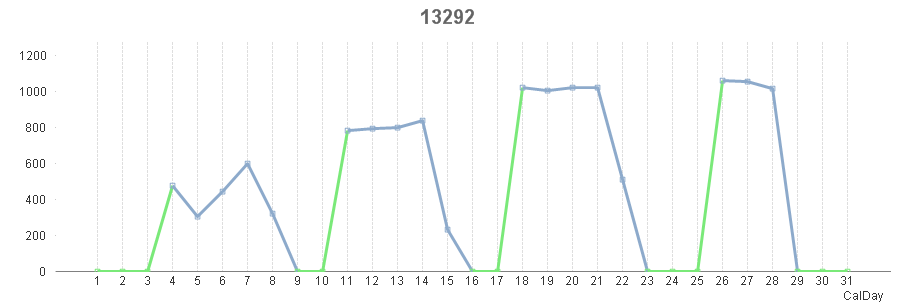
i want to color the missed days lines so i used if(sum(Sales)=0,RGB(122,233,121)) in the background color option of my expression but i'm getting this results , what's the problem here ?
