Unlock a world of possibilities! Login now and discover the exclusive benefits awaiting you.
- Qlik Community
- :
- All Forums
- :
- QlikView App Dev
- :
- displaying an AVG rent trend of lease assets in a ...
- Subscribe to RSS Feed
- Mark Topic as New
- Mark Topic as Read
- Float this Topic for Current User
- Bookmark
- Subscribe
- Mute
- Printer Friendly Page
- Mark as New
- Bookmark
- Subscribe
- Mute
- Subscribe to RSS Feed
- Permalink
- Report Inappropriate Content
displaying an AVG rent trend of lease assets in a period in a line chart
| Continent | Country | City | Lease Begin | Lease End | Price per month | Rentable area |
|---|---|---|---|---|---|---|
| Asia | Japan | Tokyo | 01.01.2011 | 31.12.2016 | 10000 | 5000 m² |
| Asia | China | Hongkong | 01.03.2011 | 28.02.2017 | 9500 | 5000 m² |
| Asia | China | Shanghai | 01.05.2011 | 31.12.2016 | 11300 | 5000 m² |
| Europe | Germany | Berlin | 01.05.2010 | 31.12.2013 | 12000 | 5000 m² |
| Europe | France | Paris | 01.01.2013 | 31.12.2013 | 13500 | 5000 m² |
| North America | USA | Washington D.C | 01.01.2012 | 31.12.2015 | 10000 | 5000 m² |
| North America | USA | Philadelphia | 01.01.2012 | 31.12.2015 | 12100 | 5000 m² |
| North America | Canada | Montreal | 01.01.2010 | 31.12.2015 | 11020 | 5000 m² |
| South Amarica | Brazilia | Sao Paolo | 01.01.2011 | 31.12.2016 | 9510 | 5000 m² |
| South Amarica | Costa Rica | San Jose | 01.01.2011 | 31.12.2016 | 8000 | 5000 m² |
| Africa | Cape Town | Bellville | 01.01.2012 | 31.12.2017 | 6000 | 5000 m² |
| Africa | Nigeria | Abuja | 01.01.2012 | 31.12.2017 | 5480 | 5000 m² |
| Africa | Cote d'Ivoire | Abidjan | 01.01.2012 | 31.12.2017 | 6500 | 5000 m² |
| Australia | Sydney | Blacktown | 01.01.2013 | 31.12.2018 | 11520 | 5000 m² |
| Australia | Newcastle City | Newcastle City | 01.01.2013 | 31.12.2018 | 10120 | 5000 m² |
How can I create a line chart where I can see the avg rent for each continent in a period from 01.XX.XXXX till 31.YY.YYYY
?
- Mark as New
- Bookmark
- Subscribe
- Mute
- Subscribe to RSS Feed
- Permalink
- Report Inappropriate Content
What does 01.xx.xxxx and 31.yy.yyyy means? Can you elaborate on this? Also if you can provide the expected output for the sample provided above, we might be able to understand the requirement better
- Mark as New
- Bookmark
- Subscribe
- Mute
- Subscribe to RSS Feed
- Permalink
- Report Inappropriate Content
01.xx.xxxx = Date begin for example 01.10.2010 , 31.YY.YYYY = End Date for example 31.12.20117
I want to compare the avg cost in this period with othere continents.
I have a bigger database where rents begin at 01.01.2019 or later. But i want to exclude them from the period. because it could have an effect on my avg price
- Mark as New
- Bookmark
- Subscribe
- Mute
- Subscribe to RSS Feed
- Permalink
- Report Inappropriate Content
And another interesting thing is.
We know the price per month is constant from the lease begin till the lease end.
So it would be interesting to to compare the average price per month with other continents in a certain period
- Mark as New
- Bookmark
- Subscribe
- Mute
- Subscribe to RSS Feed
- Permalink
- Report Inappropriate Content
From the data provided what number or numbers do you expect to see as your output?
- Mark as New
- Bookmark
- Subscribe
- Mute
- Subscribe to RSS Feed
- Permalink
- Report Inappropriate Content
for example:
Period = 01.01.2015 - 31.12.2016
Asia AVG(Price) = AVG(10000+9500+11300) = 10266,66
Europe AVG(Price) = 0 because out of period
North America AVG(Price) = AVG(10000+12100+11020) = 11040
South America AVG(Price) = AVG(9510+8000) = 8755
Africa AVG(Price) = AVG(6000+5480+6500) = 5993,33
Australia AVG(Price) = AVG(11520+10120) = 10820
Max(AVG(Price) is in North America
Lowest(AVG(Price) is in Africa
- Mark as New
- Bookmark
- Subscribe
- Mute
- Subscribe to RSS Feed
- Permalink
- Report Inappropriate Content
Hi Thanh,
A load script like this will create a calendar associated with your fact table by an IntervalMatch
Data:
LOAD Continent,
Country,
City,
Date#([Lease Begin],'DD.MM.YYYY') as [Lease Begin],
Date#([Lease End],'DD.MM.YYYY') as [Lease End],
[Price per month],
[Rentable area]
FROM
[https://community.qlik.com/thread/223428]
(html, codepage is 1252, embedded labels, table is @1);
tblMinDate:
LOAD Min(Id) as MinDate;
LOAD FieldValue('Lease Begin', recno()) as Id
AUTOGENERATE FieldValueCount('Lease Begin');
tblMaxDate:
LOAD Max(Id) as MaxDate;
LOAD FieldValue('Lease End', recno()) as Id
AUTOGENERATE FieldValueCount('Lease End');
LET vStartDate =PEEK('MinDate',0,'tblMinDate');
LET vEndDate =PEEK('MaxDate',0,'tblMaxDate');
DROP tables tblMinDate,tblMaxDate;
[Calendar]:
LOAD
*,
Ceil((PeriodID+1)/3) as QPeriodID
;
LOAD
*,
AutoNumber(MPeriod, 'MPeriodID') as PeriodID
;
Load
Year(Temp_Date) * 100 + Month(Temp_Date) as MPeriod,
Year(Temp_Date) & 'Q' & Ceil(Month(Temp_Date) / 3) as QPeriod,
Year(Temp_Date) & 'W' & Right('0'&Week(Temp_Date),2) as WPeriod,
Date(Temp_Date-WeekDay(Temp_Date),'DD/MM/YYYY') as WeekBeg,
Year(Temp_Date) as Year,
if (Ceil(Month(Temp_Date) / 3)=1,Year(Temp_Date)-1 & '/' &
Year(Temp_Date), Year(Temp_Date) & '/' & Text(Year(Temp_Date)+1) ) as [FinYear],
'Q' & Ceil(Month(Temp_Date) / 3) as Quarter,
Week(Temp_Date) as Week,
Div((Temp_Date-$(vStartDate)),7) as WeekID,
Month(Temp_Date) as Month,
Month(Temp_Date) & ' ' & Year(Temp_Date) as MthYear,
Date(Temp_Date,'$(DateFormat)') as Date;
Load $(vStartDate) -1 + IterNo() as Temp_Date
AutoGenerate 1 While $(vStartDate) -1 + IterNo() <= $(vEndDate) ;
IntervalMatch(Date) LOAD [Lease Begin], [Lease End] Resident Data;
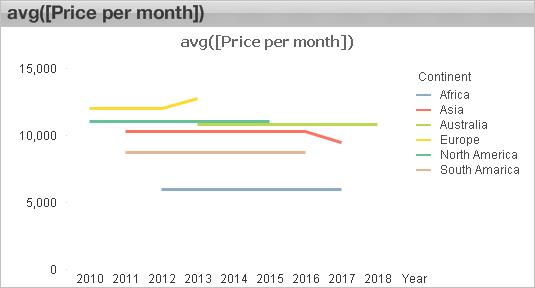
You have a choice of date dimensions to choose from for a chart. This is avg price by year and continent.
Cheers
Andrew