Unlock a world of possibilities! Login now and discover the exclusive benefits awaiting you.
- Qlik Community
- :
- All Forums
- :
- QlikView App Dev
- :
- Re: doughnut Gauge chart
- Subscribe to RSS Feed
- Mark Topic as New
- Mark Topic as Read
- Float this Topic for Current User
- Bookmark
- Subscribe
- Mute
- Printer Friendly Page
- Mark as New
- Bookmark
- Subscribe
- Mute
- Subscribe to RSS Feed
- Permalink
- Report Inappropriate Content
doughnut Gauge chart
Hi All
Please help i am trying to do doughnut Gauge chart with maybe 3 segments with below details but it doesn't work :
if is 10-50 be green
if is 51-60 be yellow
if is 61-85 be Red
- « Previous Replies
-
- 1
- 2
- Next Replies »
Accepted Solutions
- Mark as New
- Bookmark
- Subscribe
- Mute
- Subscribe to RSS Feed
- Permalink
- Report Inappropriate Content
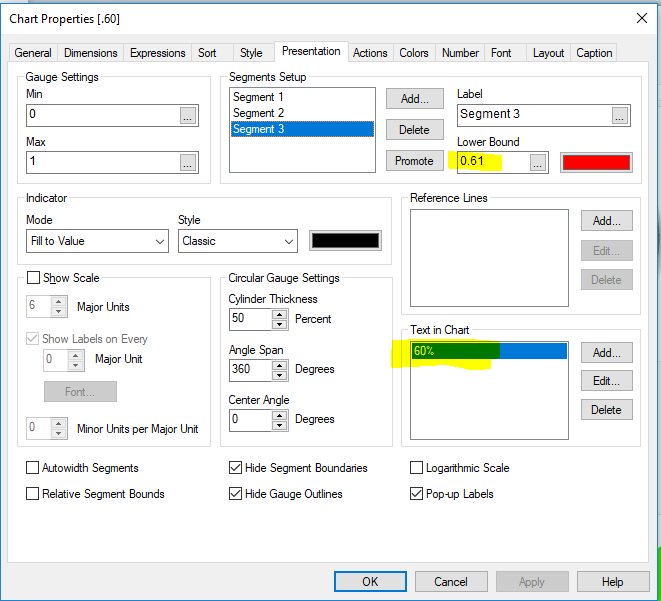
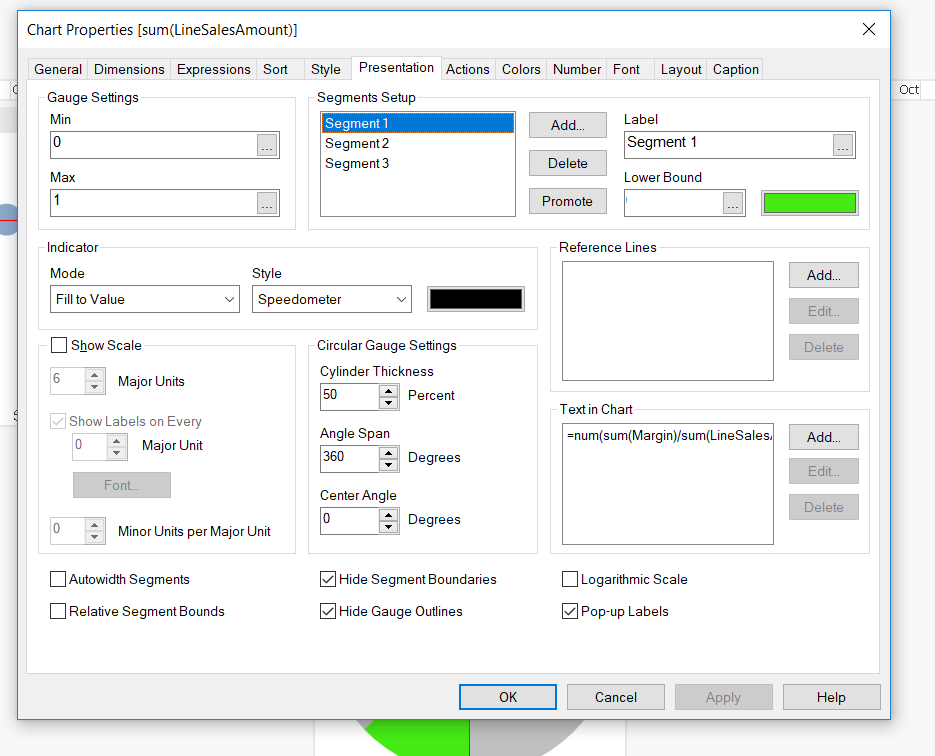
The bounds are static as per your requirement.
For the 'expression' and 'text in chart' I have used static values just to play around. You can replace both these with your desired expression.
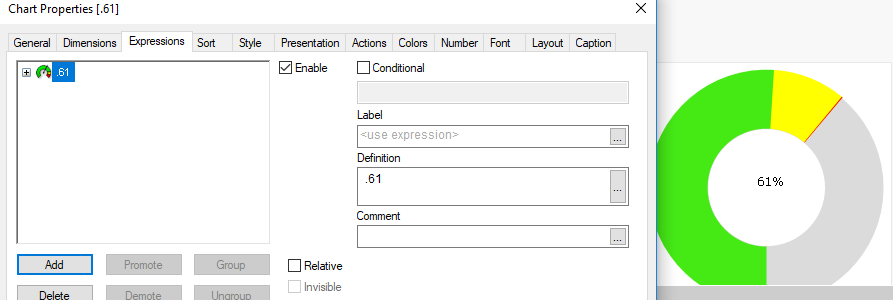
The above image shows that when the value of expression is changed to .61, the red bound comes in picture.
Unfortunately, I am not sure where you are facing the challenge.
let me know how I can help better.
- Mark as New
- Bookmark
- Subscribe
- Mute
- Subscribe to RSS Feed
- Permalink
- Report Inappropriate Content
May you are using fill to values in the presentation tab -
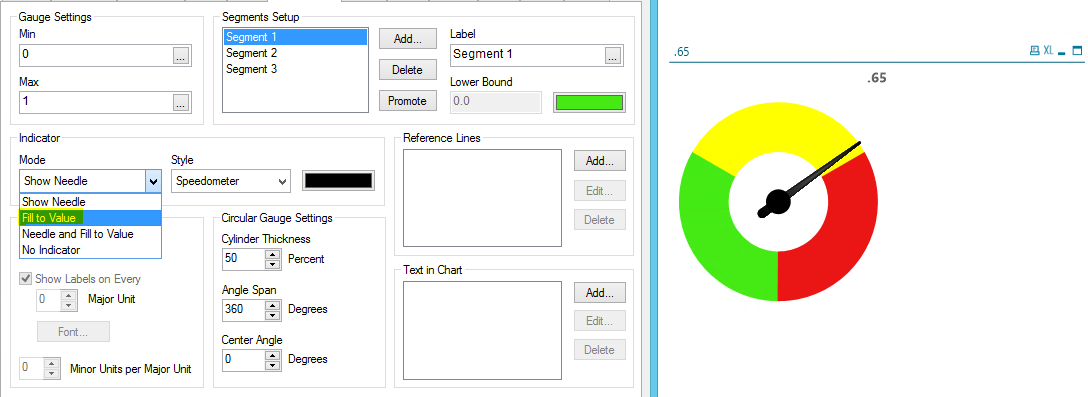
and are you overlapping two charts?
- Mark as New
- Bookmark
- Subscribe
- Mute
- Subscribe to RSS Feed
- Permalink
- Report Inappropriate Content
Hi Neelam
Firstly thanks for your response.i have than done that but i need to it to show in doughnut Gauge
I need it to be like if is 10-50 be green,if is 51-60 be yellow,if is 61-85 be Red but it doesn't work.
- Mark as New
- Bookmark
- Subscribe
- Mute
- Subscribe to RSS Feed
- Permalink
- Report Inappropriate Content
Can you share a sample file to play around?
- Mark as New
- Bookmark
- Subscribe
- Mute
- Subscribe to RSS Feed
- Permalink
- Report Inappropriate Content
Hi Neelam
I have attached below small Qvd.
I hope it will help.
- Mark as New
- Bookmark
- Subscribe
- Mute
- Subscribe to RSS Feed
- Permalink
- Report Inappropriate Content
Do you mind sharing the qvw file or can you let me know what fields and calculation you are using for the chart..
- Mark as New
- Bookmark
- Subscribe
- Mute
- Subscribe to RSS Feed
- Permalink
- Report Inappropriate Content
Hi Neelam
Please receive attached.
- Mark as New
- Bookmark
- Subscribe
- Mute
- Subscribe to RSS Feed
- Permalink
- Report Inappropriate Content
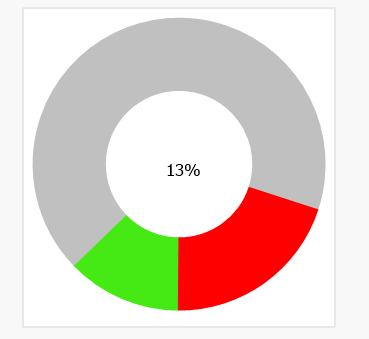
Is this what you are looking as output?
It has the bounds as 0-50, 51-60 and 61-100.
- Mark as New
- Bookmark
- Subscribe
- Mute
- Subscribe to RSS Feed
- Permalink
- Report Inappropriate Content
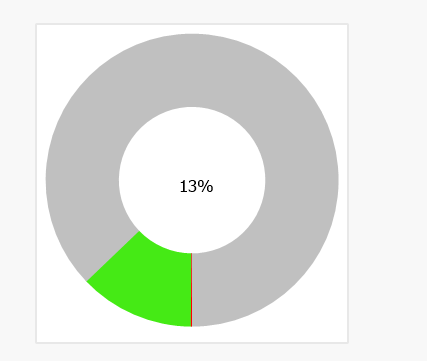
Neelam
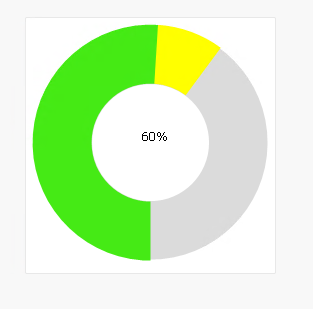
Yes but i need to display only color of the current percentage without show Needle.e.g if its 0-50 is suppose to display green color only and the other part grey/white maybe and if it is 51-60 it will show Green and Yellow not red,if is 61-100 it will show all color cause it obviously passed all colors.
I hope i am making sense.
Thanks
- Mark as New
- Bookmark
- Subscribe
- Mute
- Subscribe to RSS Feed
- Permalink
- Report Inappropriate Content
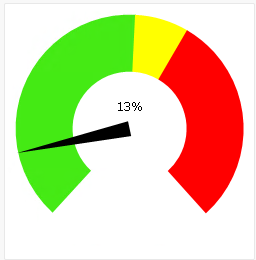
Is this how you want it to be?
- « Previous Replies
-
- 1
- 2
- Next Replies »