Unlock a world of possibilities! Login now and discover the exclusive benefits awaiting you.
- Qlik Community
- :
- All Forums
- :
- QlikView App Dev
- :
- doughnut Gauge chart
- Subscribe to RSS Feed
- Mark Topic as New
- Mark Topic as Read
- Float this Topic for Current User
- Bookmark
- Subscribe
- Mute
- Printer Friendly Page
- Mark as New
- Bookmark
- Subscribe
- Mute
- Subscribe to RSS Feed
- Permalink
- Report Inappropriate Content
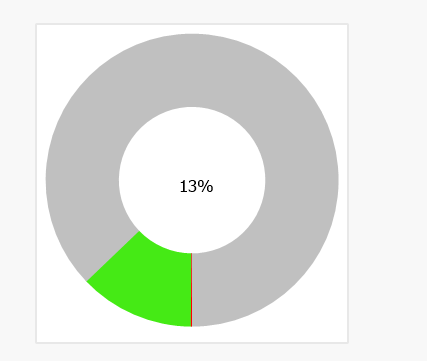
doughnut Gauge chart
Hi All
Please help i am trying to do doughnut Gauge chart with maybe 3 segments with below details but it doesn't work :
if is 10-50 be green
if is 51-60 be yellow
if is 61-85 be Red
- « Previous Replies
-
- 1
- 2
- Next Replies »
- Mark as New
- Bookmark
- Subscribe
- Mute
- Subscribe to RSS Feed
- Permalink
- Report Inappropriate Content
Hi Neelam
Yes please share the steps.
Thanks you very much.
- Mark as New
- Bookmark
- Subscribe
- Mute
- Subscribe to RSS Feed
- Permalink
- Report Inappropriate Content
Here you go.
- Mark as New
- Bookmark
- Subscribe
- Mute
- Subscribe to RSS Feed
- Permalink
- Report Inappropriate Content
Hi Neelam
Thank you very much for your help,I am having bit of situation why it is only Static not dynamic even when i am putting 61% cause it suppose to show red, your Segments is red when it is 0.61?
It doesn't change as per % or Number?
Please help.
- Mark as New
- Bookmark
- Subscribe
- Mute
- Subscribe to RSS Feed
- Permalink
- Report Inappropriate Content
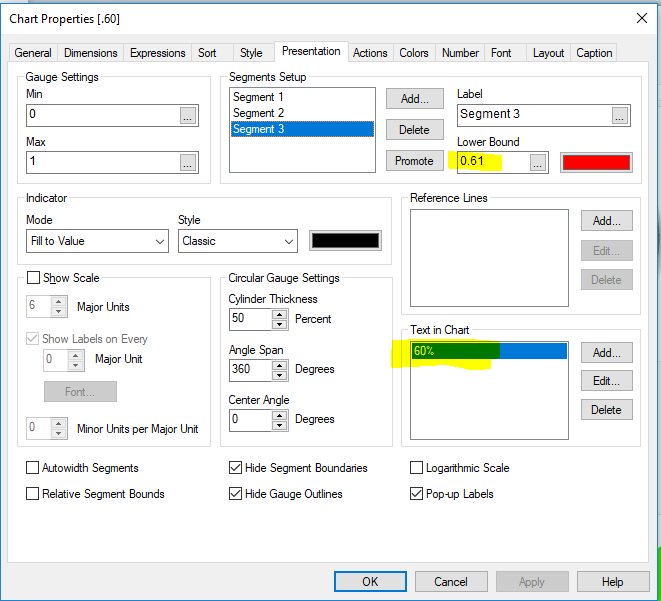
The bounds are static as per your requirement.
For the 'expression' and 'text in chart' I have used static values just to play around. You can replace both these with your desired expression.
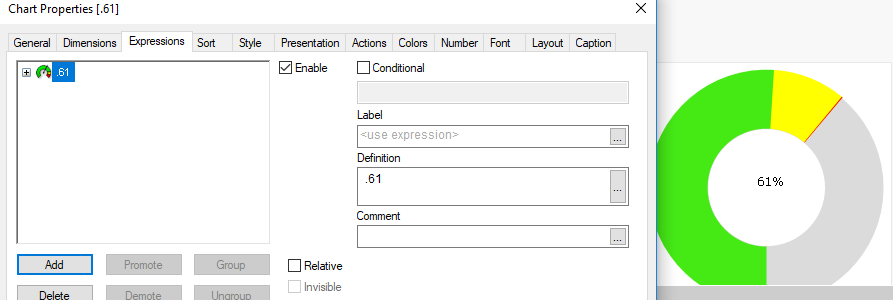
The above image shows that when the value of expression is changed to .61, the red bound comes in picture.
Unfortunately, I am not sure where you are facing the challenge.
let me know how I can help better.
- Mark as New
- Bookmark
- Subscribe
- Mute
- Subscribe to RSS Feed
- Permalink
- Report Inappropriate Content
Neelam
Thank you very very much for being patient with me you are the best.
Problem solved!
Thank you
- Mark as New
- Bookmark
- Subscribe
- Mute
- Subscribe to RSS Feed
- Permalink
- Report Inappropriate Content
I am glad it worked out fine  . Good luck!
- « Previous Replies
-
- 1
- 2
- Next Replies »