Unlock a world of possibilities! Login now and discover the exclusive benefits awaiting you.
- Qlik Community
- :
- All Forums
- :
- QlikView App Dev
- :
- Re: gauge chart to show percentages
- Subscribe to RSS Feed
- Mark Topic as New
- Mark Topic as Read
- Float this Topic for Current User
- Bookmark
- Subscribe
- Mute
- Printer Friendly Page
- Mark as New
- Bookmark
- Subscribe
- Mute
- Subscribe to RSS Feed
- Permalink
- Report Inappropriate Content
gauge chart to show percentages
Hi All
I want to show the data in a different way some thing like this

i have the percentage values as below and i'm using the expression
=sum(aggr( sum(ter)))/sum(aggr( sum(Distinct ter)))*100 where ter is the value on which i'm calculating the totals and percentages
can some one explain with sample data
| month | %age |
| jan | 12 |
| feb | 45 |
| mar | 65 |
| apr | 72 |
- « Previous Replies
-
- 1
- 2
- Next Replies »
- Mark as New
- Bookmark
- Subscribe
- Mute
- Subscribe to RSS Feed
- Permalink
- Report Inappropriate Content
For an example you can open "Data Visualization.qvw" in your Qlik installation folder,
C:\Program Files\QlikView\Examples\Documents, tab KPI
- Mark as New
- Bookmark
- Subscribe
- Mute
- Subscribe to RSS Feed
- Permalink
- Report Inappropriate Content
Are you looking for something like this,

If so refer the attached QVW.
Let me know if more info is needed.
Regards
Harish
- Mark as New
- Bookmark
- Subscribe
- Mute
- Subscribe to RSS Feed
- Permalink
- Report Inappropriate Content
Hi harish can i have the testtube charts i have 5 months values of percentages to display i will go for 5 test tubes is it possible can u pls help me out with a qvw which u prepared
- Mark as New
- Bookmark
- Subscribe
- Mute
- Subscribe to RSS Feed
- Permalink
- Report Inappropriate Content
I don't think this is possible.
Regards
Harish
- Mark as New
- Bookmark
- Subscribe
- Mute
- Subscribe to RSS Feed
- Permalink
- Report Inappropriate Content
I have percentage for a month is that possible to create testtube chart
And i'm calculating sum of a value can i create test tube in this case
Expression is sum (sales)
- Mark as New
- Bookmark
- Subscribe
- Mute
- Subscribe to RSS Feed
- Permalink
- Report Inappropriate Content
You won't be able to see separate test tubes for each month.
You may have to create separate objects for each month.
Regards
Harish
- Mark as New
- Bookmark
- Subscribe
- Mute
- Subscribe to RSS Feed
- Permalink
- Report Inappropriate Content
yes i can create i will create
i'm using the below expresiion with no dimension
=sum(aggr( sum(ter),field,Month))/sum(aggr( sum({<IsRolling6={'1'}>}Distinct Ter),k,Month))*100
and getting output as
can you please help me out
- Mark as New
- Bookmark
- Subscribe
- Mute
- Subscribe to RSS Feed
- Permalink
- Report Inappropriate Content
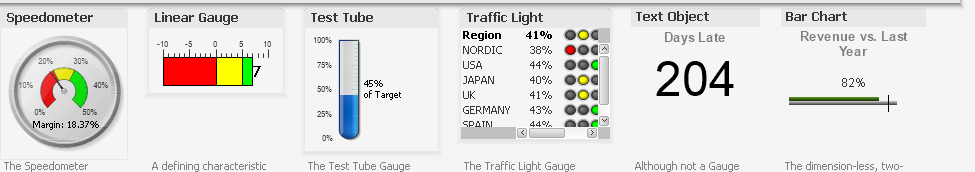
Hi John,
for the sake of clarity check this:
it is very useful, if you want to Show your numbers with gauges.
i hope that can resolve or improve your issue
beck
- Mark as New
- Bookmark
- Subscribe
- Mute
- Subscribe to RSS Feed
- Permalink
- Report Inappropriate Content
you may have to create objects as shown in the attached QVW.
Regards
Harish
- « Previous Replies
-
- 1
- 2
- Next Replies »