Unlock a world of possibilities! Login now and discover the exclusive benefits awaiting you.
- Qlik Community
- :
- All Forums
- :
- QlikView App Dev
- :
- gauge chart
- Subscribe to RSS Feed
- Mark Topic as New
- Mark Topic as Read
- Float this Topic for Current User
- Bookmark
- Subscribe
- Mute
- Printer Friendly Page
- Mark as New
- Bookmark
- Subscribe
- Mute
- Subscribe to RSS Feed
- Permalink
- Report Inappropriate Content
gauge chart
Hi,
I have a line chart showing the Sales Amount for each month for different years.
Below is the chart: (below my y-axis is sum(amount) )
| Line chart | Guage chart |
|---|---|
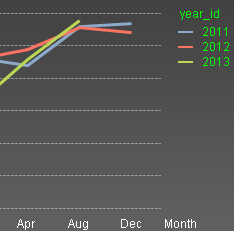 | 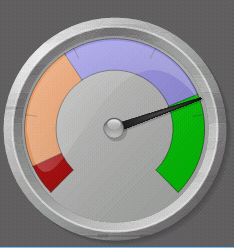 |
Also i have a gauge chart beside this line chart. where i'm showing the Sales Amount ranges for different segment.
So When i click on the line chart (say aug 2013) i will show the sales amount of that perticular yera monthwise. So for this i wanted to ahve a guage cahrt in such a way that it should show me red if the saleAmount is less than the previous year and show green if the total saleAmount is greater than the previous year.
How this can be done?
- Mark as New
- Bookmark
- Subscribe
- Mute
- Subscribe to RSS Feed
- Permalink
- Report Inappropriate Content
PFA sample .
Vikas
If the issue is solved please mark the answer with Accept as Solution & like it.
If you want to go quickly, go alone. If you want to go far, go together.
- Mark as New
- Bookmark
- Subscribe
- Mute
- Subscribe to RSS Feed
- Permalink
- Report Inappropriate Content
Hi vikas , i'm not able to open the qlikview document which you have attached as i'm using personal edition..
So can you help me with the script?