Unlock a world of possibilities! Login now and discover the exclusive benefits awaiting you.
- Qlik Community
- :
- All Forums
- :
- QlikView App Dev
- :
- Re: graph with mixed dimensions
- Subscribe to RSS Feed
- Mark Topic as New
- Mark Topic as Read
- Float this Topic for Current User
- Bookmark
- Subscribe
- Mute
- Printer Friendly Page
- Mark as New
- Bookmark
- Subscribe
- Mute
- Subscribe to RSS Feed
- Permalink
- Report Inappropriate Content
graph with mixed dimensions
Good Afternoon!
I need to create a chart, which has only one dimension, however should be mixed, which must have:
-Accumulated conducted the previous year as well as expected;
-Current year Accumulated performed as well as expected;
The well-performed as Predicted from month to month of the current year.
Can someone give me a light?
thank you,
- Mark as New
- Bookmark
- Subscribe
- Mute
- Subscribe to RSS Feed
- Permalink
- Report Inappropriate Content
Can you attach a sample file with some data and elaborate a little more on the expressions you need.
- Mark as New
- Bookmark
- Subscribe
- Mute
- Subscribe to RSS Feed
- Permalink
- Report Inappropriate Content
Hi Osni,
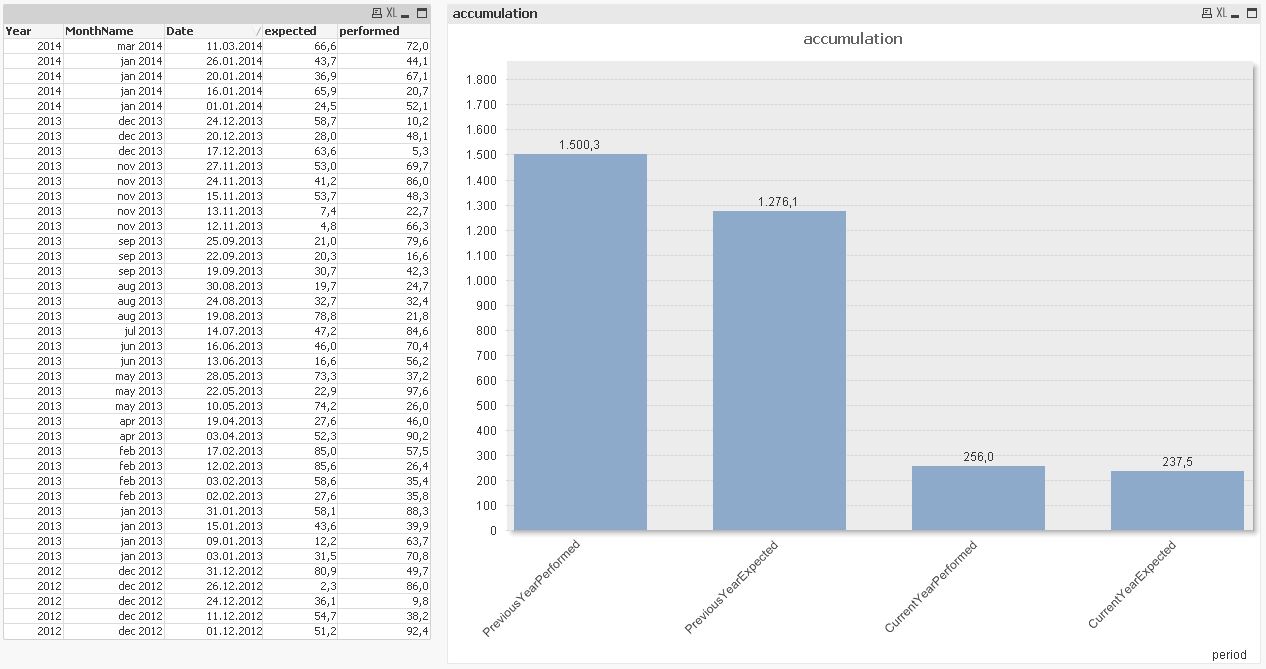
I'm also not quite clear what you need exactly, but as you mentioned that you want multiple calculations combined in only one dimension, maybe this is, what you are looking for:

I used this synthetic dimension:
=valuelist('PreviousYearPerformed', 'PreviousYearExpected', 'CurrentYearPerformed', 'CurrentYearExpected')
and this expression:
=pick(match(valuelist('PreviousYearPerformed', 'PreviousYearExpected', 'CurrentYearPerformed', 'CurrentYearExpected'),'PreviousYearPerformed', 'PreviousYearExpected', 'CurrentYearPerformed', 'CurrentYearExpected'),
sum({$<Year={$(=max(Year)-1)}>}performed),
sum({$<Year={$(=max(Year)-1)}>}expected),
sum({$<Year={$(=max(Year))}>}performed),
sum({$<Year={$(=max(Year))}>}expected)
)
Hope this helps
regards
Marco
- Mark as New
- Bookmark
- Subscribe
- Mute
- Subscribe to RSS Feed
- Permalink
- Report Inappropriate Content
Good Morning
The model described / attached by Marco Wedel, This is just a data structure that I have.
However the graph beyond the columns placed, must include the month for the current year.