Unlock a world of possibilities! Login now and discover the exclusive benefits awaiting you.
- Qlik Community
- :
- All Forums
- :
- QlikView App Dev
- :
- heat map- smooth transition in colors
- Subscribe to RSS Feed
- Mark Topic as New
- Mark Topic as Read
- Float this Topic for Current User
- Bookmark
- Subscribe
- Mute
- Printer Friendly Page
- Mark as New
- Bookmark
- Subscribe
- Mute
- Subscribe to RSS Feed
- Permalink
- Report Inappropriate Content
heat map- smooth transition in colors
Hi
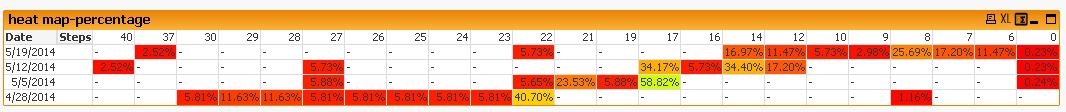
I want to create a heat map.
i want the colors to change gradually.
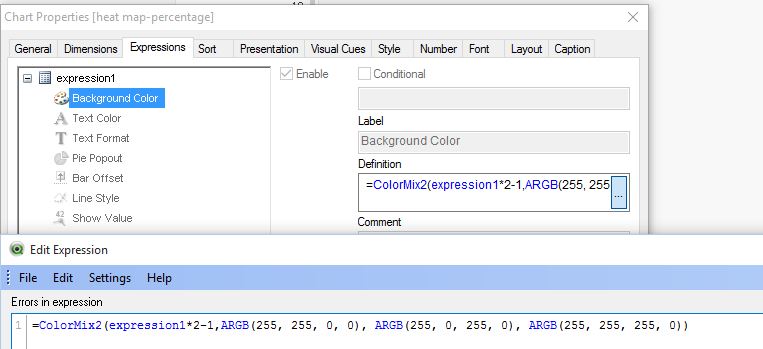
I have used colormix wizard but not getting the results properly.
I want the color to change from green to yellow to red for 100% to 0% . But i dont see that smooth change in transition of colors.
I see 58.82% value is red..while i want it to be gradually towards red when it tends to 100%.
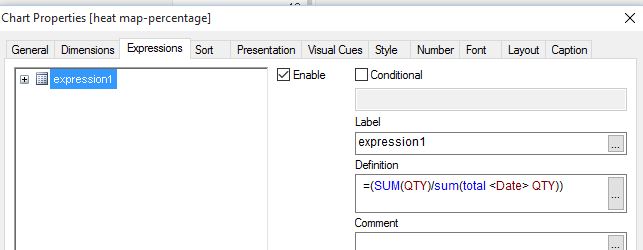
My formula is sum of qty for that particular cell by sum of total qty for that date .
(SUM(QTY)/sum(total <Date> QTY))
have attached my qvw. You may add more data to the excel if more data is needed to get the results properly
Any help is appreciated.
- Mark as New
- Bookmark
- Subscribe
- Mute
- Subscribe to RSS Feed
- Permalink
- Report Inappropriate Content
A simple app like the one I attached might help you find the right color range. It is only a simple straight table with the background color expression of an empty cell having the background color expression: HSL(....). By varying the Hue parameter from 0 to 0.26 by a step of 0.01 you get this:

So for this selected range you can basically divide your 0-100% value by 4 to get a max number of Green and min number of Red to zero. Or the opposite way by doing 1-x/4 so red is 100% and green is 0%.
This should work for you then:
HSL( x / 4 , 1 , 0.5 )
or
HSL( (1-x/4) , 1 , 0.5 )
- Mark as New
- Bookmark
- Subscribe
- Mute
- Subscribe to RSS Feed
- Permalink
- Report Inappropriate Content
Thanks for your app...
But I got confused on how to incorporate it into my problem.
Can you elaborate more on it?
Thanks,
Ria
- Mark as New
- Bookmark
- Subscribe
- Mute
- Subscribe to RSS Feed
- Permalink
- Report Inappropriate Content
Hi,
maybe one solution could be:
hope this helps
regards
Marco
- Mark as New
- Bookmark
- Subscribe
- Mute
- Subscribe to RSS Feed
- Permalink
- Report Inappropriate Content
HSL( Sum( QTY ) / Sum( TOTAL <Date> QTY ) / 4 + 0.03 , 1 , 0.5 )