Unlock a world of possibilities! Login now and discover the exclusive benefits awaiting you.
- Qlik Community
- :
- All Forums
- :
- QlikView App Dev
- :
- Re: Re: Re: help with a graph
- Subscribe to RSS Feed
- Mark Topic as New
- Mark Topic as Read
- Float this Topic for Current User
- Bookmark
- Subscribe
- Mute
- Printer Friendly Page
- Mark as New
- Bookmark
- Subscribe
- Mute
- Subscribe to RSS Feed
- Permalink
- Report Inappropriate Content
help with a graph
I have a table with dates. Monday dates to be specific (9/1/2014, 9/8/2014, 9/15/2014, 9/22/2014..etc)
I use a graph to display the data and on my x-axis, I want to cycle between Weeks and Months.
I tried to create a cycle group with the week from my table and then I used the master calendar 'Months' to view in months but whenever I see it on the graph, it shows me as 1,2,3,4,5,6,7,8,9,10,11,12 and only shows the month name if I only select one month...
any idea on how to fix this?
- « Previous Replies
-
- 1
- 2
- Next Replies »
- Mark as New
- Bookmark
- Subscribe
- Mute
- Subscribe to RSS Feed
- Permalink
- Report Inappropriate Content
Hi,
your example has no month dimension included.
The week dimension again is just an integer that looks like a weekname.
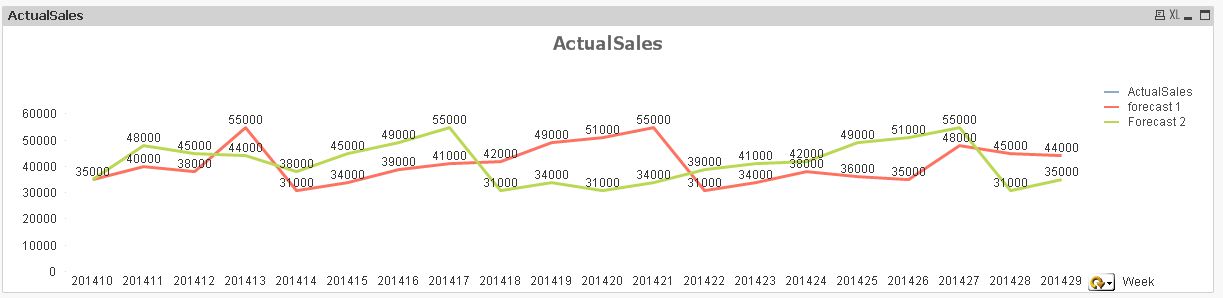
I tried to generate a cyclic group using these expressions:
For Week:
=Dual(Week,MakeWeekDate(Left(Week,4),Right(Week,2)))
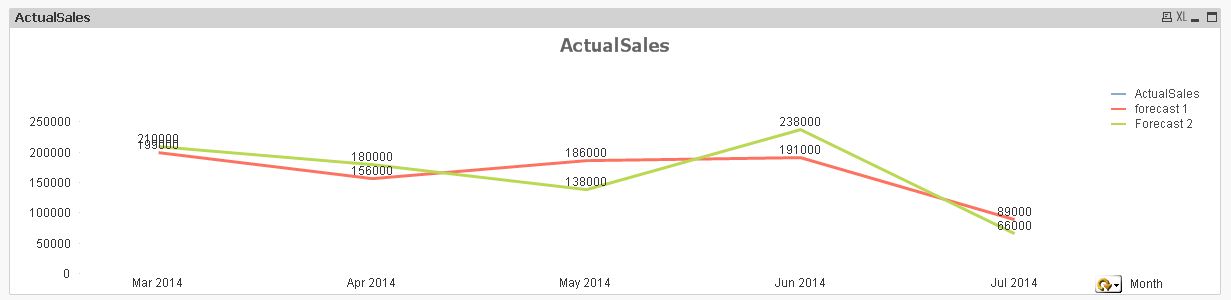
For Month:
=MonthName(MakeWeekDate(Left(Week,4),Right(Week,2)))
The result looks like:
better use expressions like these at script level to create new fields from your source dates.
hope this helps
regards
Marco
- Mark as New
- Bookmark
- Subscribe
- Mute
- Subscribe to RSS Feed
- Permalink
- Report Inappropriate Content
Thank you Jonathan and Marco for your help!!
- Mark as New
- Bookmark
- Subscribe
- Mute
- Subscribe to RSS Feed
- Permalink
- Report Inappropriate Content
you're welcome
regards
Marco
- « Previous Replies
-
- 1
- 2
- Next Replies »