Unlock a world of possibilities! Login now and discover the exclusive benefits awaiting you.
- Qlik Community
- :
- All Forums
- :
- QlikView App Dev
- :
- help with a graph
- Subscribe to RSS Feed
- Mark Topic as New
- Mark Topic as Read
- Float this Topic for Current User
- Bookmark
- Subscribe
- Mute
- Printer Friendly Page
- Mark as New
- Bookmark
- Subscribe
- Mute
- Subscribe to RSS Feed
- Permalink
- Report Inappropriate Content
help with a graph
I have a table with dates. Monday dates to be specific (9/1/2014, 9/8/2014, 9/15/2014, 9/22/2014..etc)
I use a graph to display the data and on my x-axis, I want to cycle between Weeks and Months.
I tried to create a cycle group with the week from my table and then I used the master calendar 'Months' to view in months but whenever I see it on the graph, it shows me as 1,2,3,4,5,6,7,8,9,10,11,12 and only shows the month name if I only select one month...
any idea on how to fix this?
- « Previous Replies
-
- 1
- 2
- Next Replies »
Accepted Solutions
- Mark as New
- Bookmark
- Subscribe
- Mute
- Subscribe to RSS Feed
- Permalink
- Report Inappropriate Content
Hi,
your example has no month dimension included.
The week dimension again is just an integer that looks like a weekname.
I tried to generate a cyclic group using these expressions:
For Week:
=Dual(Week,MakeWeekDate(Left(Week,4),Right(Week,2)))
For Month:
=MonthName(MakeWeekDate(Left(Week,4),Right(Week,2)))
The result looks like:
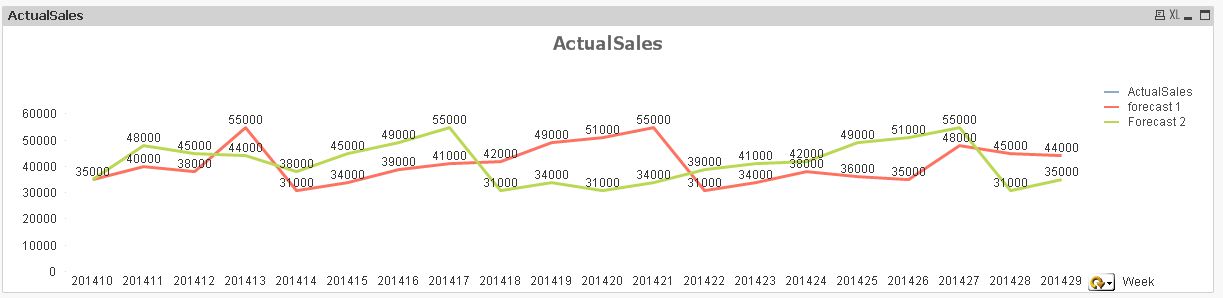
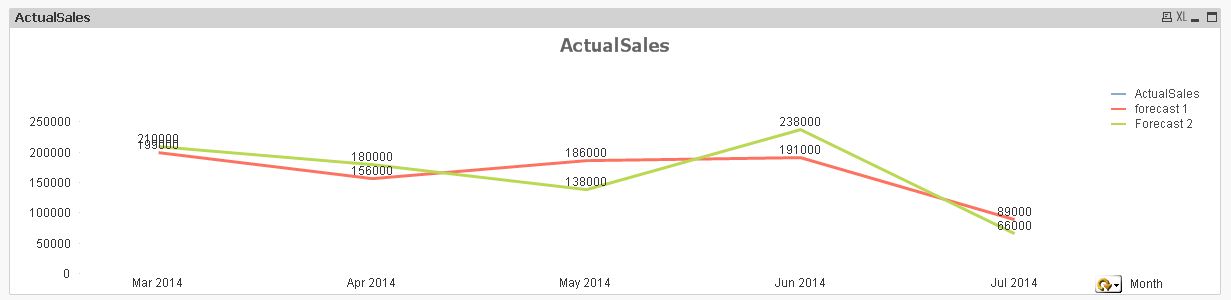
better use expressions like these at script level to create new fields from your source dates.
hope this helps
regards
Marco
- Mark as New
- Bookmark
- Subscribe
- Mute
- Subscribe to RSS Feed
- Permalink
- Report Inappropriate Content
Here is a sample with Month Names (MMM) and weeks (Monday Dates).
In the month field in the cycle i used: =left(MonthName(Date),3) to format a MM/DD/YYYY as MMM and the Date field to show the Monday Dates (weeks)
Does that help ?
- Mark as New
- Bookmark
- Subscribe
- Mute
- Subscribe to RSS Feed
- Permalink
- Report Inappropriate Content
It is giving me a 'No numeric values on x-axis' error... any idea on why this is happening?
- Mark as New
- Bookmark
- Subscribe
- Mute
- Subscribe to RSS Feed
- Permalink
- Report Inappropriate Content
i'm guessing you need to uncheck 'continuous' on the Axis tab of the chart properties. I didn't have that checked in the sample screenshot above. Let me know if you see any issues disabling it.
- Mark as New
- Bookmark
- Subscribe
- Mute
- Subscribe to RSS Feed
- Permalink
- Report Inappropriate Content
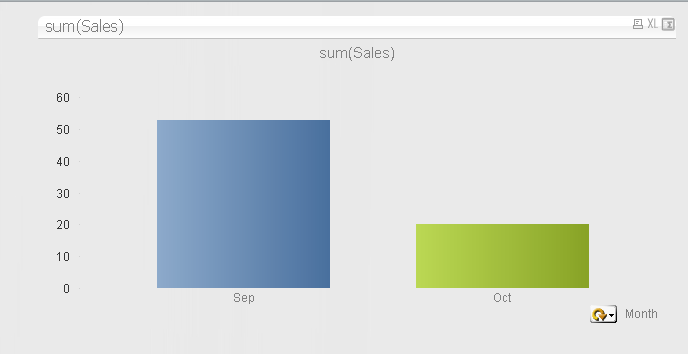
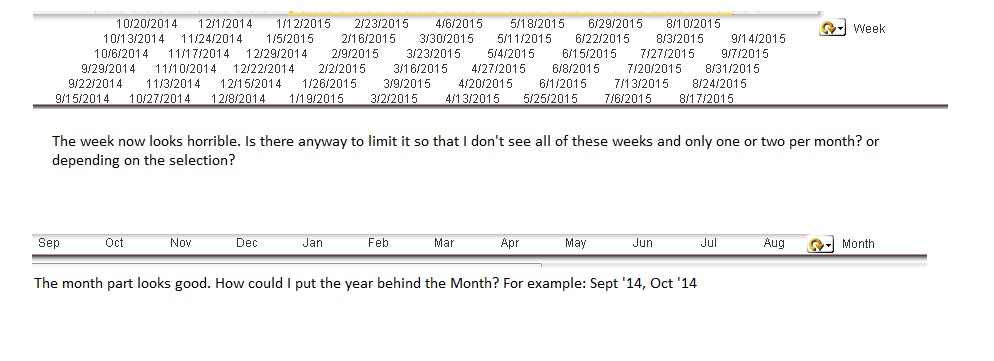
That helped but take a look at the picture attached.
1) Is there any way to limit the number of weeks shown on the graph without choosing 'continuous' option
2) how can I also show year at the end of month (i.e Sept '14, Oct '14, etc)
- Mark as New
- Bookmark
- Subscribe
- Mute
- Subscribe to RSS Feed
- Permalink
- Report Inappropriate Content
Try using this expression for month to format the Date into a month of your need:
Date(Date,'MMM-YY')
or maybe
Date(Date,'MMM YY')
For the X axis, on the axis tab, try changing the labels to be a 45 degrees and on the presentation tab under chart scrolling, enable the x-axis scrollbar after 15 or 20 values.
You can also change the font size of the label to 7 or 8pt font on the axis tab. See if that helps somewhat.
- Mark as New
- Bookmark
- Subscribe
- Mute
- Subscribe to RSS Feed
- Permalink
- Report Inappropriate Content
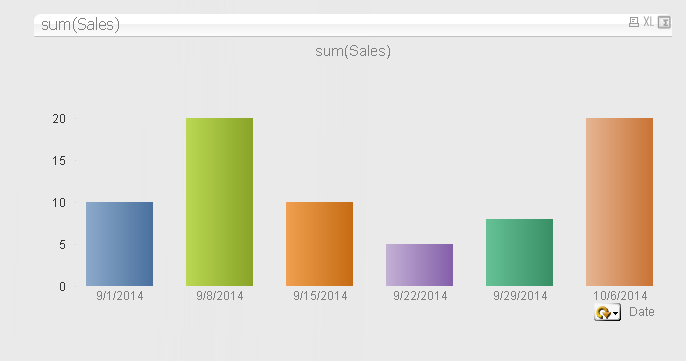
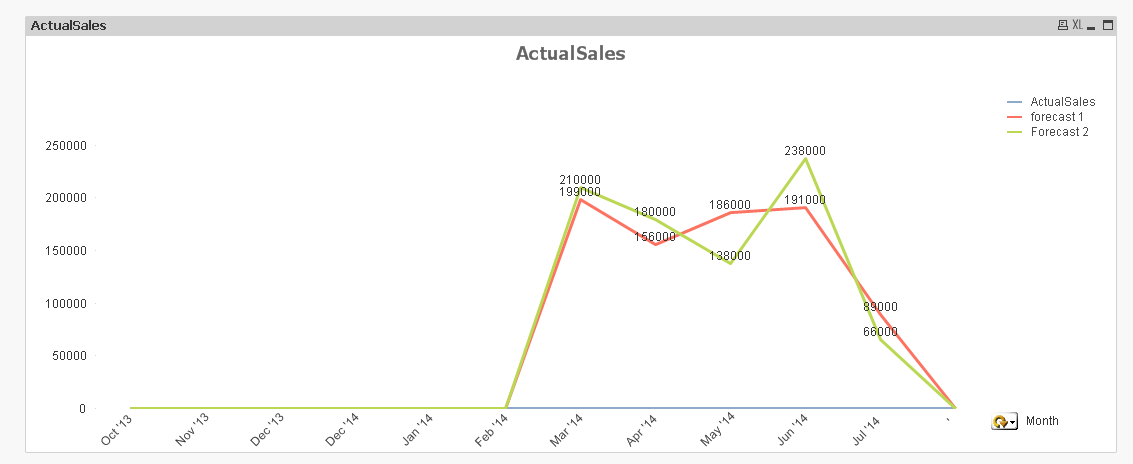
The 'Date(Date,'MMM-YY')' does not work correctly. see attached picture. It shows a month and year for each monday date..
- Mark as New
- Bookmark
- Subscribe
- Mute
- Subscribe to RSS Feed
- Permalink
- Report Inappropriate Content
please post randomized sample app, otherwise it's just guessing ...
thanks
regards
Marco
- Mark as New
- Bookmark
- Subscribe
- Mute
- Subscribe to RSS Feed
- Permalink
- Report Inappropriate Content
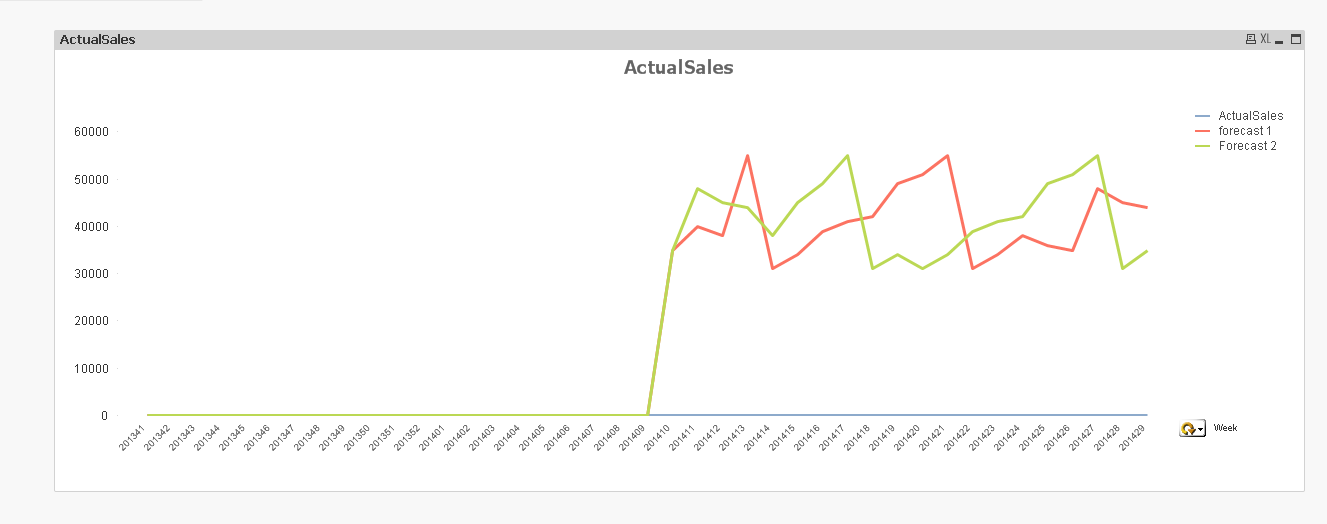
Marco - here is an example. For some reason, when I click on the 'Month' cycle, it says no data available...
The goal is to have the graph be able to cycle between weeks and months.
I would like this format (month-yy) when it is in Months (Aug '14, Sept '14, Oct '14, Jan '15, etc) if possible
- Mark as New
- Bookmark
- Subscribe
- Mute
- Subscribe to RSS Feed
- Permalink
- Report Inappropriate Content
Got it.
With your YYYYWW format yoiu can use this to get the MMM 'YY format:
= left(MonthName( MakeWeekDate( left(Week,4) ,right(Week,2))),3)& ' ' & chr(39) & mid( Week,3,2)
- « Previous Replies
-
- 1
- 2
- Next Replies »