Unlock a world of possibilities! Login now and discover the exclusive benefits awaiting you.
- Qlik Community
- :
- All Forums
- :
- QlikView App Dev
- :
- hide\unhide charts on certain field selection
- Subscribe to RSS Feed
- Mark Topic as New
- Mark Topic as Read
- Float this Topic for Current User
- Bookmark
- Subscribe
- Mute
- Printer Friendly Page
- Mark as New
- Bookmark
- Subscribe
- Mute
- Subscribe to RSS Feed
- Permalink
- Report Inappropriate Content
hide\unhide charts on certain field selection
Hi all,
how can I make a certain chart hidden the moment I make any selection on a certain field?
and then make it unhidden when any selections on this field are cleared.
Thanks,
Boris
- Mark as New
- Bookmark
- Subscribe
- Mute
- Subscribe to RSS Feed
- Permalink
- Report Inappropriate Content
Hi,
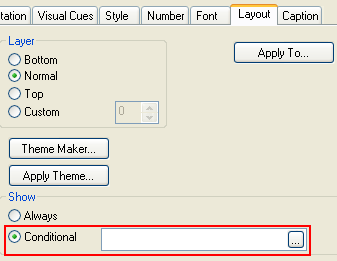
you have to write an expression in show conditional in layout tab of the object.
In this expression use the GetSelectedCount
- Mark as New
- Bookmark
- Subscribe
- Mute
- Subscribe to RSS Feed
- Permalink
- Report Inappropriate Content
Hi
Try like this
Chart properties -> Layout -> Show conditional -> =GetSelectedCount(FieldName)
Hope it helps
Please close the thread by marking correct answer & give likes if you like the post.
- Mark as New
- Bookmark
- Subscribe
- Mute
- Subscribe to RSS Feed
- Permalink
- Report Inappropriate Content
Please check enclosed file...
Layout
Show
Conditional...
To see the chart, pls select any customer..
- Mark as New
- Bookmark
- Subscribe
- Mute
- Subscribe to RSS Feed
- Permalink
- Report Inappropriate Content
Hi Boris,
Right click on teh chart, Properties--Layout tab, in "Show" section, you can click on radi button conditional and then write the condition on which you want your chart to be shown,

in your case it will be something like:
GetSelectedCOunt([Field Name]) =0
So, the chart will be shown when there are no selections in the field "Field Name".
Hope this helps!
- Mark as New
- Bookmark
- Subscribe
- Mute
- Subscribe to RSS Feed
- Permalink
- Report Inappropriate Content
Hi,
I am trying to do the exact opposite. I want a chart to appear only when a user has select a single value within a given field. I was expecting the following to work:
"GetSelectedCOunt([Field Name]) <> 0"
But it doesn't seem to. I want it so that when a user has made a selection which is down to a group of records that all have the same distinct values in the field [fieldA] then it will show the graph, in all other situations it will remain hidden. Can anyone guide me?