Unlock a world of possibilities! Login now and discover the exclusive benefits awaiting you.
- Qlik Community
- :
- All Forums
- :
- QlikView App Dev
- :
- horizonal table
- Subscribe to RSS Feed
- Mark Topic as New
- Mark Topic as Read
- Float this Topic for Current User
- Bookmark
- Subscribe
- Mute
- Printer Friendly Page
- Mark as New
- Bookmark
- Subscribe
- Mute
- Subscribe to RSS Feed
- Permalink
- Report Inappropriate Content
horizonal table
Hi All,
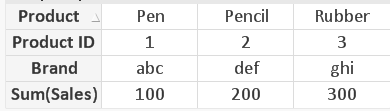
I have to create a report(may be in a straight table). But the format of the report should be like below, ie. Dimensions & expressions should be one below the other and and little space and again another set in same fashion.
Product - Pen
Product ID - 1
Brand - abc
Sales Amount - 100
Product - Pencil
Product ID - 2
Brand - efj
Sales Amount - 150
Product - Rubber
Product ID - 3
Brand - xyz
Sales Amount - 40
Please suggest me, how to achieve this.
- « Previous Replies
- Next Replies »
Accepted Solutions
- Mark as New
- Bookmark
- Subscribe
- Mute
- Subscribe to RSS Feed
- Permalink
- Report Inappropriate Content
here the solution with blank rows after each block 🙂
- Mark as New
- Bookmark
- Subscribe
- Mute
- Subscribe to RSS Feed
- Permalink
- Report Inappropriate Content
This will default come, When you use Pivot Table and then option for Partial Sum from Presentation for Dimensions
- Mark as New
- Bookmark
- Subscribe
- Mute
- Subscribe to RSS Feed
- Permalink
- Report Inappropriate Content
can you share sample data for both load file and output report.(in a table format)?
- Mark as New
- Bookmark
- Subscribe
- Mute
- Subscribe to RSS Feed
- Permalink
- Report Inappropriate Content
Thanks for the reply.
I want dimensions one below the other. The options you have specified doesn't format the table as I shown above.
- Mark as New
- Bookmark
- Subscribe
- Mute
- Subscribe to RSS Feed
- Permalink
- Report Inappropriate Content
Hi Shaila,
Here is the data.
LOAD * INLINE [
Product, ProductID, Brand, Sales Amount
Pen, 1, abc, 100
Pencil, 2, efj, 150
Rubber, 3, xyz, 50
];
- Mark as New
- Bookmark
- Subscribe
- Mute
- Subscribe to RSS Feed
- Permalink
- Report Inappropriate Content
and output?
- Mark as New
- Bookmark
- Subscribe
- Mute
- Subscribe to RSS Feed
- Permalink
- Report Inappropriate Content
The output I mentioned in my initial post.
- Mark as New
- Bookmark
- Subscribe
- Mute
- Subscribe to RSS Feed
- Permalink
- Report Inappropriate Content
try this in a textbox:
= 'Product - '& subfield(Concat(DISTINCT(Product),'|',1),'|',1)&Chr(10)&
'Product ID - '&subfield(Concat(DISTINCT(ProductID),'|',1),'|',1)&Chr(10)&
'Brand -'& subfield(Concat(DISTINCT(Brand),'|',1),'|',1)&Chr(10)&
'Sales Amount -'&subfield(Concat(DISTINCT([Sales Amount]),'|',1),'|',1)&Chr(10)&
Chr(10)&
'Product - '& subfield(Concat(DISTINCT(Product),'|',1),'|',2)&Chr(10)&
'Product ID - '&subfield(Concat(DISTINCT(ProductID),'|',1),'|',2)&Chr(10)&
'Brand -'& subfield(Concat(DISTINCT(Brand),'|',1),'|',2)&Chr(10)&
'Sales Amount -'&subfield(Concat(DISTINCT([Sales Amount]),'|',1),'|',2)&Chr(10)&
Chr(10)&
'Product - '& subfield(Concat(DISTINCT(Product),'|',1),'|',3)&Chr(10)&
'Product ID - '&subfield(Concat(DISTINCT(ProductID),'|',1),'|',3)&Chr(10)&
'Brand -'& subfield(Concat(DISTINCT(Brand),'|',1),'|',3)&Chr(10)&
'Sales Amount -'&subfield(Concat(DISTINCT([Sales Amount]),'|',1),'|',3)&Chr(10)&
hope this helps
- Mark as New
- Bookmark
- Subscribe
- Mute
- Subscribe to RSS Feed
- Permalink
- Report Inappropriate Content
I doubt, Whether we have that option. It takes much time right while we have more than 10/15 slides.
How about this?
- Mark as New
- Bookmark
- Subscribe
- Mute
- Subscribe to RSS Feed
- Permalink
- Report Inappropriate Content
Or else, always we need to create each table together and then club, This must be a Work Around
- « Previous Replies
- Next Replies »