Unlock a world of possibilities! Login now and discover the exclusive benefits awaiting you.
- Qlik Community
- :
- All Forums
- :
- QlikView App Dev
- :
- Re: how to calculate max drawdown
- Subscribe to RSS Feed
- Mark Topic as New
- Mark Topic as Read
- Float this Topic for Current User
- Bookmark
- Subscribe
- Mute
- Printer Friendly Page
- Mark as New
- Bookmark
- Subscribe
- Mute
- Subscribe to RSS Feed
- Permalink
- Report Inappropriate Content
how to calculate max drawdown
I have a table:
Date,P&L
May 1,100
May 2,100
May 3,-50
May 4,200
May 5,-100
May 6,-200
the Cumulative P&L is
Date,Cumulative P&L
May 1,100
May 2,200
May 3,150
May 4,350
May 5,250
May 6,50
the drawdown is defined as drop from previous peak cumulative P&L
Date,Drawdown
May 1,0
May 2,0
May 3,50
May 4,0
May 5,100
May 6,300
so Max drawdown is 300
I want to put it in the qlivkiew formula so that when I select a range of dates, the max drawdown value is automatically calculated.
- Mark as New
- Bookmark
- Subscribe
- Mute
- Subscribe to RSS Feed
- Permalink
- Report Inappropriate Content
QlikView calculation is dynamic. In your case, put Max(Drawdown) in text box. Add Date list box.
Select the date ranges from list box, you can see that text box value changes based on your date range selection.
Thanks,
Vinod Kumar V
- Mark as New
- Bookmark
- Subscribe
- Mute
- Subscribe to RSS Feed
- Permalink
- Report Inappropriate Content
but I need qlikview to calculate the drawdown.
- Mark as New
- Bookmark
- Subscribe
- Mute
- Subscribe to RSS Feed
- Permalink
- Report Inappropriate Content
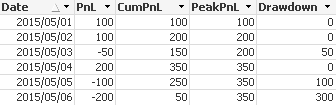
To do this in the load script:
PnL:
LOAD *,
RangeMax(0, PeakPnL- CumPnL) As Drawdown
;
LOAD *,
RangeMax(Peek(PeakPnL), CumPnL) As PeakPnL
;
LOAD *,
PnL + Alt(Peek(CumPnL), 0) As CumPnL
;
LOAD Date(Date#(Year(Today()) & Date, 'YYYYMMMM D')) As Date,
PnL
Inline
[
Date,PnL
May 1,100
May 2,100
May 3,-50
May 4,200
May 5,-100
May 6,-200
];
(change the inline load to your actual data source)
- Mark as New
- Bookmark
- Subscribe
- Mute
- Subscribe to RSS Feed
- Permalink
- Report Inappropriate Content
this doesn't work as cumpnl needs dynamically change upon the dates selected.
e.g. if I select only May 5 and May 6, the cumpnl is -100, -300, and drawdown are 0