Unlock a world of possibilities! Login now and discover the exclusive benefits awaiting you.
- Qlik Community
- :
- All Forums
- :
- QlikView App Dev
- :
- how to calculate top 10 in straight table and wit ...
- Subscribe to RSS Feed
- Mark Topic as New
- Mark Topic as Read
- Float this Topic for Current User
- Bookmark
- Subscribe
- Mute
- Printer Friendly Page
- Mark as New
- Bookmark
- Subscribe
- Mute
- Subscribe to RSS Feed
- Permalink
- Report Inappropriate Content
how to calculate top 10 in straight table and wit top 10 subtotal with 3 dimension and 3 expression
Hoping someone can help. I have a Straight table with the displayed values limited to the Top 10. What I'd like to calculate is the sub-total for that Top 10. I also need to subtotal the entire data.
Does anyone have any ideas?
Much appreciated!
- Mark as New
- Bookmark
- Subscribe
- Mute
- Subscribe to RSS Feed
- Permalink
- Report Inappropriate Content
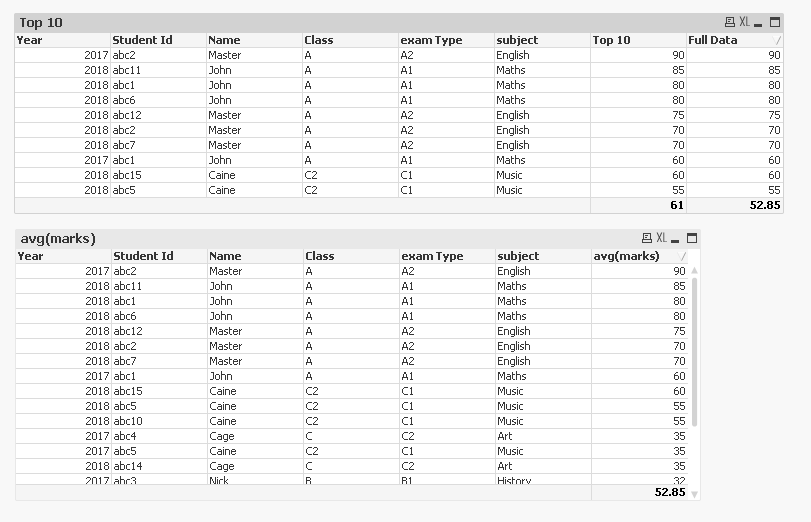
Is this the expected result?
In chart properties > presentation > check "Max Number".
Expression for top 10 :
avg({<[Student Id] ={"=Rank(avg(marks))<=11 "}>} marks)
Refer attached qvw for reference.
Thanks and regards,
Arthur Fong
- Mark as New
- Bookmark
- Subscribe
- Mute
- Subscribe to RSS Feed
- Permalink
- Report Inappropriate Content
Hi,
Thanks for the response but I am expecting something different.
I have 3 dimension and 3 expressions. Now on 1st dimension, I need top 10 records and display the sum of top 10 and Others and also the total amount. And also need to sort on one of the expression/
- Mark as New
- Bookmark
- Subscribe
- Mute
- Subscribe to RSS Feed
- Permalink
- Report Inappropriate Content
Maybe you can provide a sample qvw and your expected output?
- Mark as New
- Bookmark
- Subscribe
- Mute
- Subscribe to RSS Feed
- Permalink
- Report Inappropriate Content
I need in this format.I have given top 5 data.
- Mark as New
- Bookmark
- Subscribe
- Mute
- Subscribe to RSS Feed
- Permalink
- Report Inappropriate Content
Amita, in this situation, it is most likely going to require that you post a sample app with your data model and chart with expressions etc. It does not have to be the full set of data, but enough that folks will be able to see how the data model is setup and what you are doing with the expressions. Not sure you are going to get what you need otherwise on this one, as it is a bit difficult to follow without being able to see the other detail. Just wanted to try to move things forward for you. If you have some confidential fields, you can use the Settings\Document Properties\Scrambling tab to scramble those, but if any of those fields are being used in your expressions, that may prove problematic as well.
Regards,
Brett
I now work a compressed schedule, Tuesday, Wednesday and Thursday, so those will be the days I will reply to any follow-up posts.
