Unlock a world of possibilities! Login now and discover the exclusive benefits awaiting you.
Announcements
Save $650 on Qlik Connect, Dec 1 - 7, our lowest price of the year. Register with code CYBERWEEK: Register
- Qlik Community
- :
- All Forums
- :
- QlikView App Dev
- :
- Re: how to change scale value
Options
- Subscribe to RSS Feed
- Mark Topic as New
- Mark Topic as Read
- Float this Topic for Current User
- Bookmark
- Subscribe
- Mute
- Printer Friendly Page
Turn on suggestions
Auto-suggest helps you quickly narrow down your search results by suggesting possible matches as you type.
Showing results for
Creator II
2017-08-03
05:23 AM
- Mark as New
- Bookmark
- Subscribe
- Mute
- Subscribe to RSS Feed
- Permalink
- Report Inappropriate Content
how to change scale value
Hi ,
In excel I am having data like below
| Column% |
| 100.00 |
| 88.89 |
| 90.91 |
| 90.48 |
| 89.29 |
| 100.00 |
These are percentage values, in expression column I need to take avg of this column.
when I try to show it in chart all y axis values are overlapping to each other.
what scale value should I set for Y axis.
attaching image herewith.
696 Views
1 Solution
Accepted Solutions
Master III
2017-08-03
06:04 AM
- Mark as New
- Bookmark
- Subscribe
- Mute
- Subscribe to RSS Feed
- Permalink
- Report Inappropriate Content
2 Replies
Creator
2017-08-03
05:58 AM
- Mark as New
- Bookmark
- Subscribe
- Mute
- Subscribe to RSS Feed
- Permalink
- Report Inappropriate Content
Hi kumari,
Please find the attached image.may be help you.
Best Regards
Anji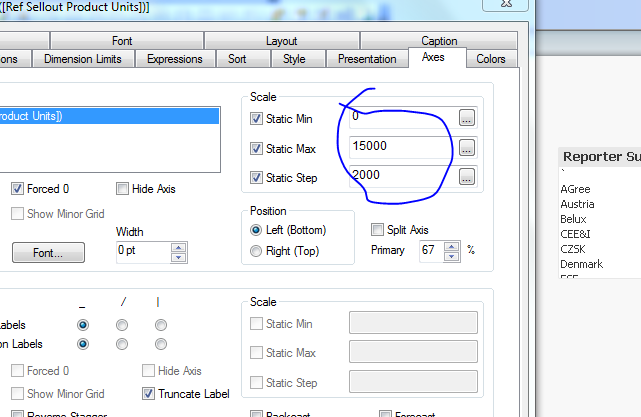
628 Views
Master III
2017-08-03
06:04 AM
- Mark as New
- Bookmark
- Subscribe
- Mute
- Subscribe to RSS Feed
- Permalink
- Report Inappropriate Content
Uncheck
