Unlock a world of possibilities! Login now and discover the exclusive benefits awaiting you.
Announcements
Join us to spark ideas for how to put the latest capabilities into action. Register here!
- Qlik Community
- :
- All Forums
- :
- QlikView App Dev
- :
- Re: how to display 2 expressions
Options
- Subscribe to RSS Feed
- Mark Topic as New
- Mark Topic as Read
- Float this Topic for Current User
- Bookmark
- Subscribe
- Mute
- Printer Friendly Page
Turn on suggestions
Auto-suggest helps you quickly narrow down your search results by suggesting possible matches as you type.
Showing results for
Not applicable
2013-01-22
01:22 AM
- Mark as New
- Bookmark
- Subscribe
- Mute
- Subscribe to RSS Feed
- Permalink
- Report Inappropriate Content
how to display 2 expressions
I want to display my attendance and non-attendance data in 1 bar graph per month.
This is the data:
| Attended or Not | non-attendance 200 150 300July | Now I am only able to display the attendance in 1 graph and the non attendance in another graph as the expression says error when I try to do SUM (attendance) SUM (non-attendance).August | Can anyone assist with this? - ThanksSeptember |
| Non-Attendance | 4960 | 5944 | 4347 |
| Attendance | 21759 | 27846 | 11711 |
- Tags:
- new_to_qlikview
1,128 Views
7 Replies
Master II
2013-01-22
01:39 AM
- Mark as New
- Bookmark
- Subscribe
- Mute
- Subscribe to RSS Feed
- Permalink
- Report Inappropriate Content
hi
see the attached file
1,025 Views
Not applicable
2013-01-22
01:39 AM
Author
- Mark as New
- Bookmark
- Subscribe
- Mute
- Subscribe to RSS Feed
- Permalink
- Report Inappropriate Content
Hi
use 2 expr
1st expr
if(
Attended
or Not
='Attendance',sum(july)+sum(august)+sum(september),Null())
2nd exp
if(
Attended
or Not
='Non-Attendance',sum(july)+sum(august)+sum(september),Null())
1,024 Views
Not applicable
2013-01-22
01:48 AM
Author
- Mark as New
- Bookmark
- Subscribe
- Mute
- Subscribe to RSS Feed
- Permalink
- Report Inappropriate Content
Thanks, however I cannot open the file as I am using the personal edition. Please can you send me the expression
1,024 Views
Not applicable
2013-01-22
01:48 AM
Author
- Mark as New
- Bookmark
- Subscribe
- Mute
- Subscribe to RSS Feed
- Permalink
- Report Inappropriate Content
Thanks, but it says "Bad expression"
1,024 Views
Not applicable
2013-01-22
01:52 AM
Author
- Mark as New
- Bookmark
- Subscribe
- Mute
- Subscribe to RSS Feed
- Permalink
- Report Inappropriate Content
Hi
can u give ur expressions
im using some sample data its work
plz see that image
it display empno=1 sum in one bar and 2 in another bar same like ur
ateendend, not-attend
1,024 Views
Not applicable
2013-01-22
02:00 AM
Author
- Mark as New
- Bookmark
- Subscribe
- Mute
- Subscribe to RSS Feed
- Permalink
- Report Inappropriate Content
I think it does not find Attendance and Non-Attendance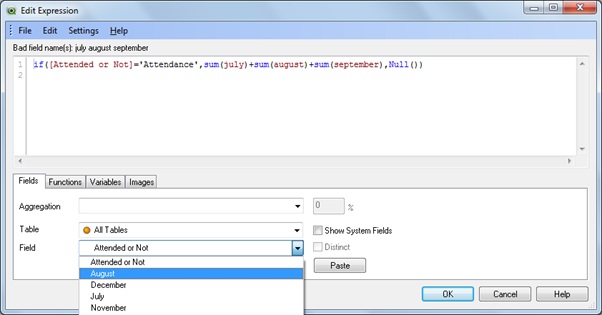
1,024 Views
Not applicable
2013-01-22
02:10 AM
Author
- Mark as New
- Bookmark
- Subscribe
- Mute
- Subscribe to RSS Feed
- Permalink
- Report Inappropriate Content
Thanks, I have sorted it out.
1,024 Views