Unlock a world of possibilities! Login now and discover the exclusive benefits awaiting you.
- Qlik Community
- :
- All Forums
- :
- QlikView App Dev
- :
- how to show 0% and 100% values for line chart in Q...
- Subscribe to RSS Feed
- Mark Topic as New
- Mark Topic as Read
- Float this Topic for Current User
- Bookmark
- Subscribe
- Mute
- Printer Friendly Page
- Mark as New
- Bookmark
- Subscribe
- Mute
- Subscribe to RSS Feed
- Permalink
- Report Inappropriate Content
how to show 0% and 100% values for line chart in Qlikview
Hi Experts,
I have created line chart with following expressions
1. =num((Sum([Total release wise UAT Defects])/Sum([DefectList.No.of Iterations]))*100,'#,##')&'%'
2. =num((Sum([DefectList.No.of Iterations])-Sum([Total release wise UAT Defects]))/num(Sum([DefectList.No.of Iterations]),'###0')*100,'##,##')&'%'
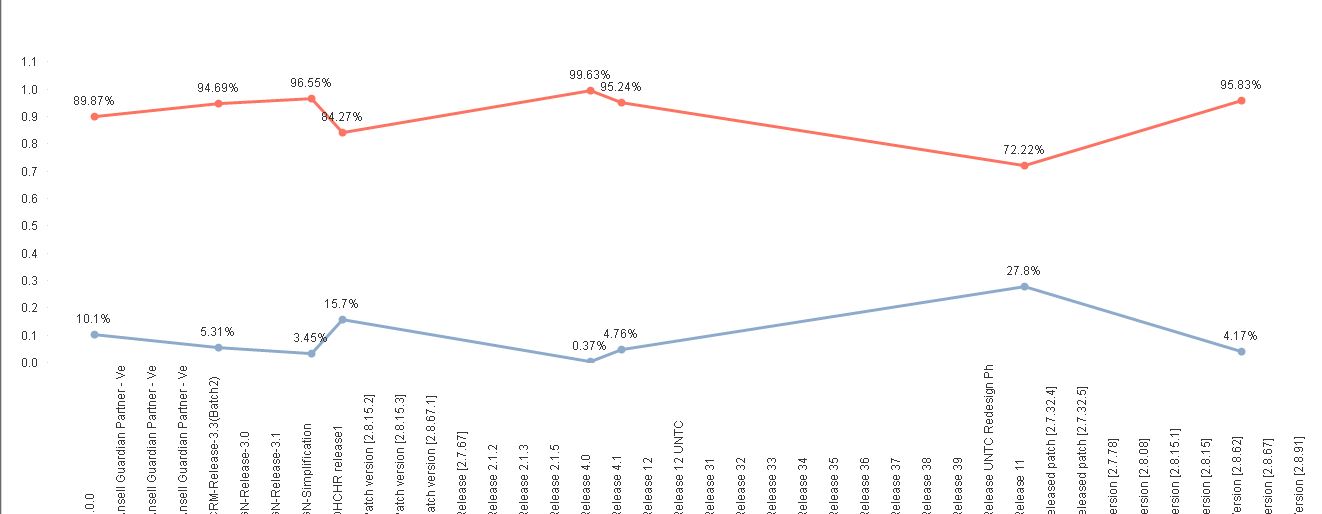
it is giving output correctly. but it's not showing 0%'s and 100%'s Values in my line chart. how to show them also
This is what i created chart
- « Previous Replies
-
- 1
- 2
- Next Replies »
Accepted Solutions
- Mark as New
- Bookmark
- Subscribe
- Mute
- Subscribe to RSS Feed
- Permalink
- Report Inappropriate Content
ExpressionTab:
Exp1:
=(Sum([Total release wise UAT Defects])/Sum([DefectList.No.of Iterations]))
Exp2:
=(Sum([DefectList.No.of Iterations])-Sum([Total release wise UAT Defects]))/(Sum([DefectList.No.of Iterations]))
PresentationTab:
Uncheck Supress Zero Values
check Zero on Bar
NumbersTab:
Fixed to 2 Decimals
check show in Percent
- Mark as New
- Bookmark
- Subscribe
- Mute
- Subscribe to RSS Feed
- Permalink
- Report Inappropriate Content
please share qvw!
- Mark as New
- Bookmark
- Subscribe
- Mute
- Subscribe to RSS Feed
- Permalink
- Report Inappropriate Content
Hi Frank,
Here i attached qvw please have a look and give the possible solution
Thank you in advance
- Mark as New
- Bookmark
- Subscribe
- Mute
- Subscribe to RSS Feed
- Permalink
- Report Inappropriate Content
not sure if i understood your requirement correctly,
but have a look at the attached qvw
- Mark as New
- Bookmark
- Subscribe
- Mute
- Subscribe to RSS Feed
- Permalink
- Report Inappropriate Content
Hi Frank,
I am using Personal edition. Can please write here what you have changed in the chart
Thank you in advance
- Mark as New
- Bookmark
- Subscribe
- Mute
- Subscribe to RSS Feed
- Permalink
- Report Inappropriate Content
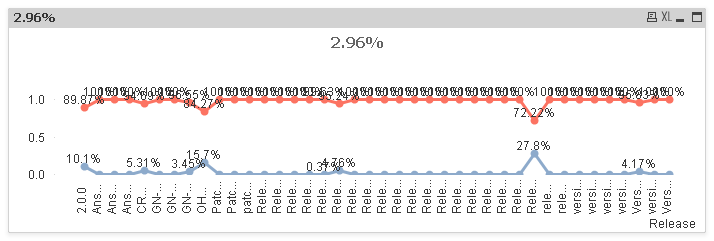
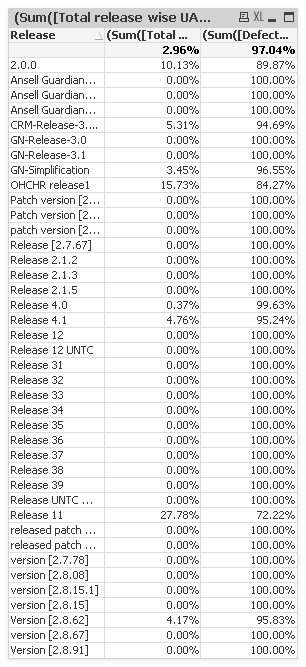
is this what you want to achieve?
- Mark as New
- Bookmark
- Subscribe
- Mute
- Subscribe to RSS Feed
- Permalink
- Report Inappropriate Content
Hi Frank,
Yeah i need like this and as well as i want to show 0%'s also
Can you please how you implemented it
- Mark as New
- Bookmark
- Subscribe
- Mute
- Subscribe to RSS Feed
- Permalink
- Report Inappropriate Content
ExpressionTab:
Exp1:
=(Sum([Total release wise UAT Defects])/Sum([DefectList.No.of Iterations]))
Exp2:
=(Sum([DefectList.No.of Iterations])-Sum([Total release wise UAT Defects]))/(Sum([DefectList.No.of Iterations]))
PresentationTab:
Uncheck Supress Zero Values
check Zero on Bar
NumbersTab:
Fixed to 2 Decimals
check show in Percent
- Mark as New
- Bookmark
- Subscribe
- Mute
- Subscribe to RSS Feed
- Permalink
- Report Inappropriate Content
Hi Frank,
I have used same thing. it's some thing better but it is showing above 100 percents also why?? can you please suggest for that also
- Mark as New
- Bookmark
- Subscribe
- Mute
- Subscribe to RSS Feed
- Permalink
- Report Inappropriate Content
i cant see any values above 100%
- « Previous Replies
-
- 1
- 2
- Next Replies »