Unlock a world of possibilities! Login now and discover the exclusive benefits awaiting you.
- Qlik Community
- :
- All Forums
- :
- QlikView App Dev
- :
- how to show a staright table expression in a list ...
- Subscribe to RSS Feed
- Mark Topic as New
- Mark Topic as Read
- Float this Topic for Current User
- Bookmark
- Subscribe
- Mute
- Printer Friendly Page
- Mark as New
- Bookmark
- Subscribe
- Mute
- Subscribe to RSS Feed
- Permalink
- Report Inappropriate Content
how to show a staright table expression in a list box
Hi all,
I have a straight table with 4 expressions and 3 dimensions and one of the expression (variance) having positive and negative values ,
my requirements is I need to create a list box as filter its should show 'positive' n 'negative' if user selects negative, only negative values should display in straight table and vice versa..
Thanks in advance
santhosh
- « Previous Replies
- Next Replies »
- Mark as New
- Bookmark
- Subscribe
- Mute
- Subscribe to RSS Feed
- Permalink
- Report Inappropriate Content
Hi Venkat,
Please find the attachment for the solution .
.
- Mark as New
- Bookmark
- Subscribe
- Mute
- Subscribe to RSS Feed
- Permalink
- Report Inappropriate Content
you can do it, without list box...
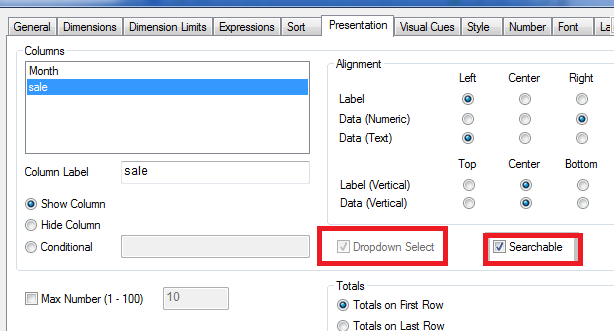
go to your straight table properties>> presentation>> and select you expression and check searchable,
remember, the searchable option is available only for expressions, for dimension it is not available, but dropdownselect is available for dimension...see the image
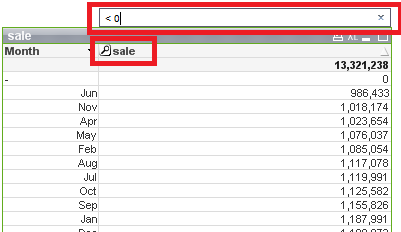
and now you go to your table, you will see small icon for search, in your column...click it, you will see search box,
clear search box and type < 0 press enter, you will see only value are less than zero..for type > 0 for positive values..
see the image
hope it helps....
- Mark as New
- Bookmark
- Subscribe
- Mute
- Subscribe to RSS Feed
- Permalink
- Report Inappropriate Content
Hi Israrkhan,
thanks for your quick reply and its is helpful, but I need to control negative values and positive values with list box .. do you have any idea..?
- Mark as New
- Bookmark
- Subscribe
- Mute
- Subscribe to RSS Feed
- Permalink
- Report Inappropriate Content
Hi can you please send the attachment as I didn't get the attachment.
- Mark as New
- Bookmark
- Subscribe
- Mute
- Subscribe to RSS Feed
- Permalink
- Report Inappropriate Content
I Think you try like....
Create a Inline table,
Table:
Load * INLINE [
ValueType
Positive
Negative
];
Than create a list box for this ValueType..now you will have two value is list boxas
Positive
Negative
and go to table expressions modify your expressions like
if(GetFieldSelection(ValueType) = 'Positive', if( VarianceColumn > 0, VarianceColumn , null) , if(GetFieldSelection(ValueType) = 'Negative', if(VarianceColumn < 0, VarianceColumn , null )))
and select suppress null values..
try some thing like...
it might help
or share the document, i will try to help...
- Mark as New
- Bookmark
- Subscribe
- Mute
- Subscribe to RSS Feed
- Permalink
- Report Inappropriate Content
Hi Venkat,
pliz look at the image i have generated i have tested on the data u gave and seemed to work 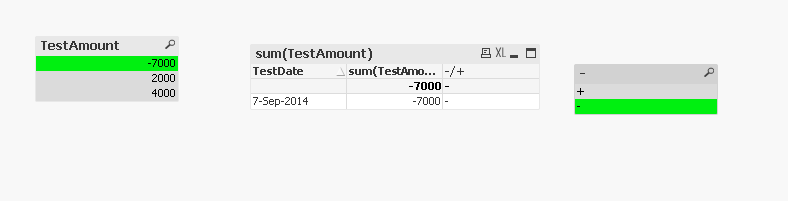
the thing i did was to create an additional calculated field to the chart
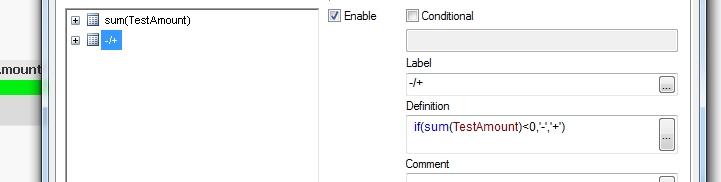
let me know if it answers your question
- Mark as New
- Bookmark
- Subscribe
- Mute
- Subscribe to RSS Feed
- Permalink
- Report Inappropriate Content
Hi please send me the attachment.
and do the needful
- Mark as New
- Bookmark
- Subscribe
- Mute
- Subscribe to RSS Feed
- Permalink
- Report Inappropriate Content
hi Ram i have attached the file
look at the file attached
- Mark as New
- Bookmark
- Subscribe
- Mute
- Subscribe to RSS Feed
- Permalink
- Report Inappropriate Content
Hi Avinash,,
Thanks for you test file
its helpful but my scenario is I have a straight table with 5 dimensions and four expressions ,
one of the expression is giving all the positive and negative values,
now can filter those positive or negative values by using a list box...?
Venkat.
- « Previous Replies
- Next Replies »