Unlock a world of possibilities! Login now and discover the exclusive benefits awaiting you.
- Qlik Community
- :
- All Forums
- :
- QlikView App Dev
- :
- Re: how to show two dimension on a single chart? ...
Options
- Subscribe to RSS Feed
- Mark Topic as New
- Mark Topic as Read
- Float this Topic for Current User
- Bookmark
- Subscribe
- Mute
- Printer Friendly Page
Turn on suggestions
Auto-suggest helps you quickly narrow down your search results by suggesting possible matches as you type.
Showing results for
Not applicable
2017-05-06
07:46 AM
- Mark as New
- Bookmark
- Subscribe
- Mute
- Subscribe to RSS Feed
- Permalink
- Report Inappropriate Content
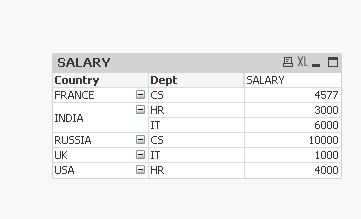
how to show two dimension on a single chart? suppose i have a student table and i want to show the min salary of student group by country and department...
suppose i have a student table and i want to show the min salary of student group by country and department...how can i do it?
676 Views
6 Replies
Anonymous
Not applicable
2017-05-06
02:01 PM
Author
- Mark as New
- Bookmark
- Subscribe
- Mute
- Subscribe to RSS Feed
- Permalink
- Report Inappropriate Content
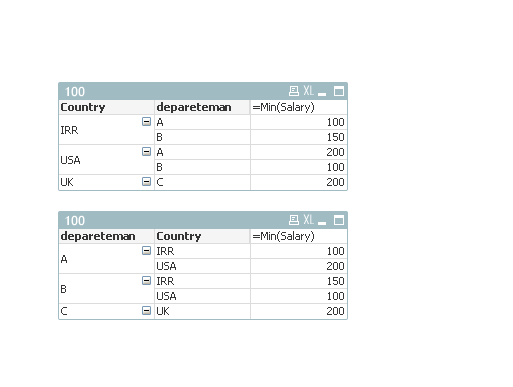
Do want something like this?
I prepare a sample for u in attached file
580 Views
Specialist III
2017-05-06
02:02 PM
- Mark as New
- Bookmark
- Subscribe
- Mute
- Subscribe to RSS Feed
- Permalink
- Report Inappropriate Content
Can you provide a snapshot of what you're trying to achieve?, because it's fuzzy.
580 Views
Master
2017-05-07
02:51 AM
- Mark as New
- Bookmark
- Subscribe
- Mute
- Subscribe to RSS Feed
- Permalink
- Report Inappropriate Content
may be like ds?
580 Views
Not applicable
2017-05-07
07:21 AM
Author
- Mark as New
- Bookmark
- Subscribe
- Mute
- Subscribe to RSS Feed
- Permalink
- Report Inappropriate Content
yes i want this,but i want to represent it in a chart,so for that what type of chart should i use and what is the procedure?
580 Views
Not applicable
2017-05-07
07:29 AM
Author
- Mark as New
- Bookmark
- Subscribe
- Mute
- Subscribe to RSS Feed
- Permalink
- Report Inappropriate Content
i want to show the min salary of ee department in india by a chart ,which type of chart should i use and what is the procedure...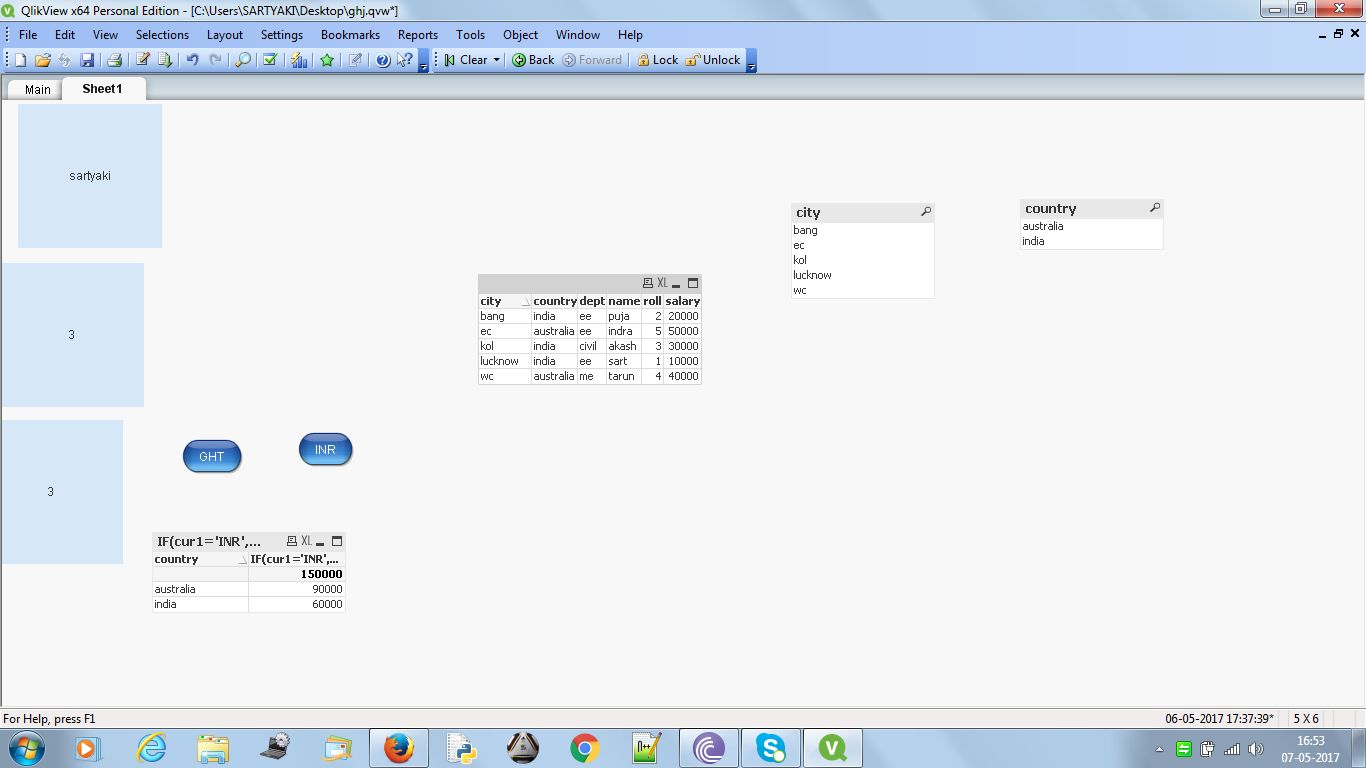
580 Views
Master
2017-05-08
07:26 AM
- Mark as New
- Bookmark
- Subscribe
- Mute
- Subscribe to RSS Feed
- Permalink
- Report Inappropriate Content
Hi
Open charts and select PIVOT chart.
I can try if you can share the excel.
580 Views