Unlock a world of possibilities! Login now and discover the exclusive benefits awaiting you.
- Qlik Community
- :
- All Forums
- :
- QlikView App Dev
- :
- Re: how to solve this in QlikView?
- Subscribe to RSS Feed
- Mark Topic as New
- Mark Topic as Read
- Float this Topic for Current User
- Bookmark
- Subscribe
- Mute
- Printer Friendly Page
- Mark as New
- Bookmark
- Subscribe
- Mute
- Subscribe to RSS Feed
- Permalink
- Report Inappropriate Content
how to solve this in QlikView?
The customer is looking for something like this:
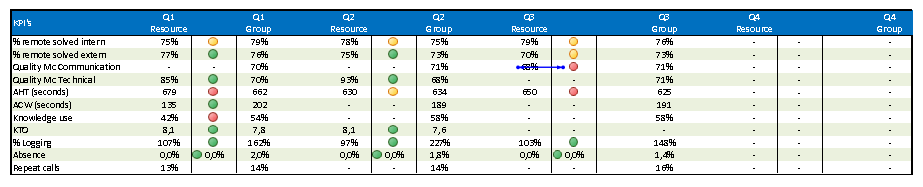
The hard thing in this is that the first column are the expressions (vertically viewed).
On top are 2 dimensions (Quarter and Type).
If there are only 'numbers' shown this is not hard to do ... but the customer really needs some sort of traffic lights columns in between.
Anyone got suggestions how to fix this in any way?
thx in advance!!
Anita
- « Previous Replies
-
- 1
- 2
- Next Replies »
- Mark as New
- Bookmark
- Subscribe
- Mute
- Subscribe to RSS Feed
- Permalink
- Report Inappropriate Content
Hi:
I usually do that like Patrick is telling you. Have on mind that images are not exportable to excel. To solve this problem, use UNICODE symbols with colors.
If you have a pivoted dimension, as far as I see, you need 3 expressions.
It is possible to create fake dimensions in your script to build some objects. If you need a 2nd dimension inside Quarter, create an inline dim, wit 3 values A, B, C and then go like:
if(FakeDim='A', A-expression, if(FakeDim='B', ...
Salutes.
- Mark as New
- Bookmark
- Subscribe
- Mute
- Subscribe to RSS Feed
- Permalink
- Report Inappropriate Content
HI
i have a question?
How i can set lights of traffic lights in gauge chart at qlik view?
thanks
- « Previous Replies
-
- 1
- 2
- Next Replies »