Unlock a world of possibilities! Login now and discover the exclusive benefits awaiting you.
- Qlik Community
- :
- All Forums
- :
- QlikView App Dev
- :
- Re: ignore the dimension
- Subscribe to RSS Feed
- Mark Topic as New
- Mark Topic as Read
- Float this Topic for Current User
- Bookmark
- Subscribe
- Mute
- Printer Friendly Page
- Mark as New
- Bookmark
- Subscribe
- Mute
- Subscribe to RSS Feed
- Permalink
- Report Inappropriate Content
ignore the dimension
Help, people are kind. Sorry for my english (translator)![]()
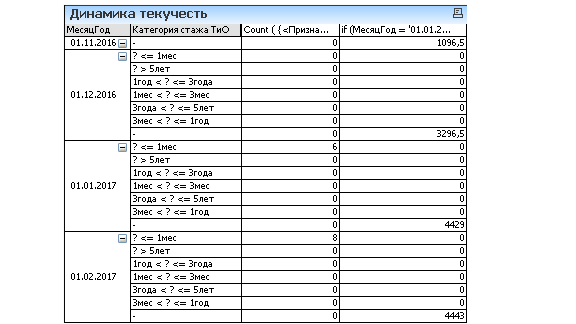
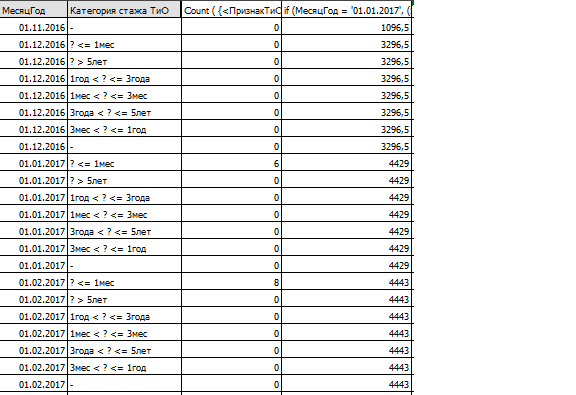
How can I make the numbers in the second column in all dimensions (measurements from another table, so, accordingly, he does not count on them). We can say that he ignored the second dimension.
The first measurement of the MonthYear, second - Experience

should work out like that. is this real?
- « Previous Replies
- Next Replies »
- Mark as New
- Bookmark
- Subscribe
- Mute
- Subscribe to RSS Feed
- Permalink
- Report Inappropriate Content
Do you want this chart to calculated always for latest month? if any other month is selected, chart should exclude that selection. is it what you want?
- Mark as New
- Bookmark
- Subscribe
- Mute
- Subscribe to RSS Feed
- Permalink
- Report Inappropriate Content
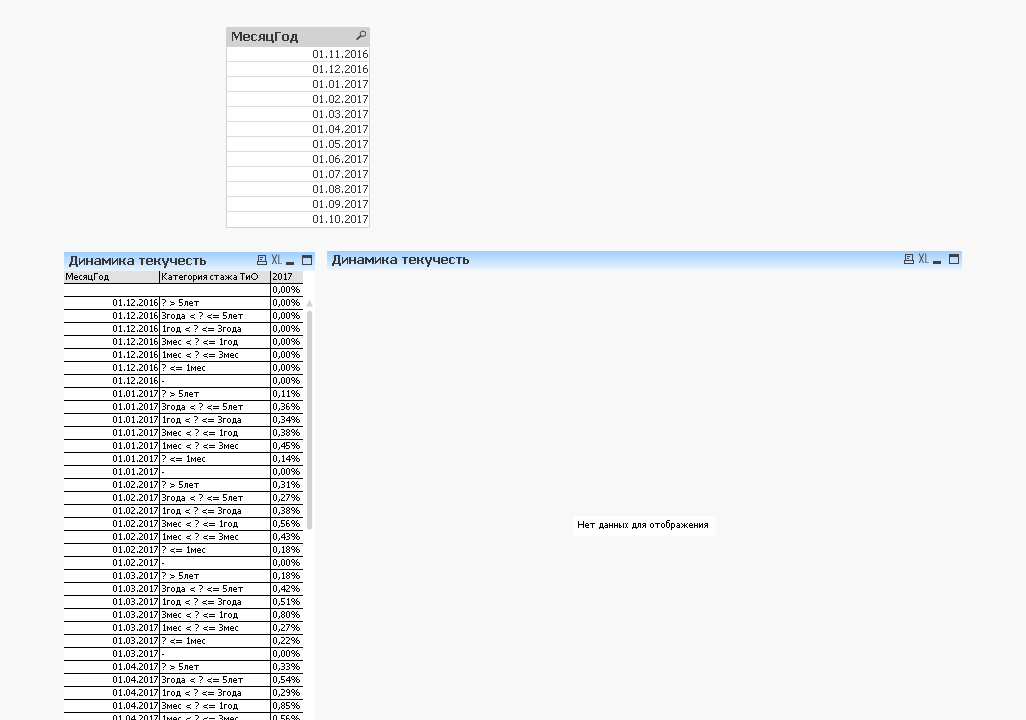
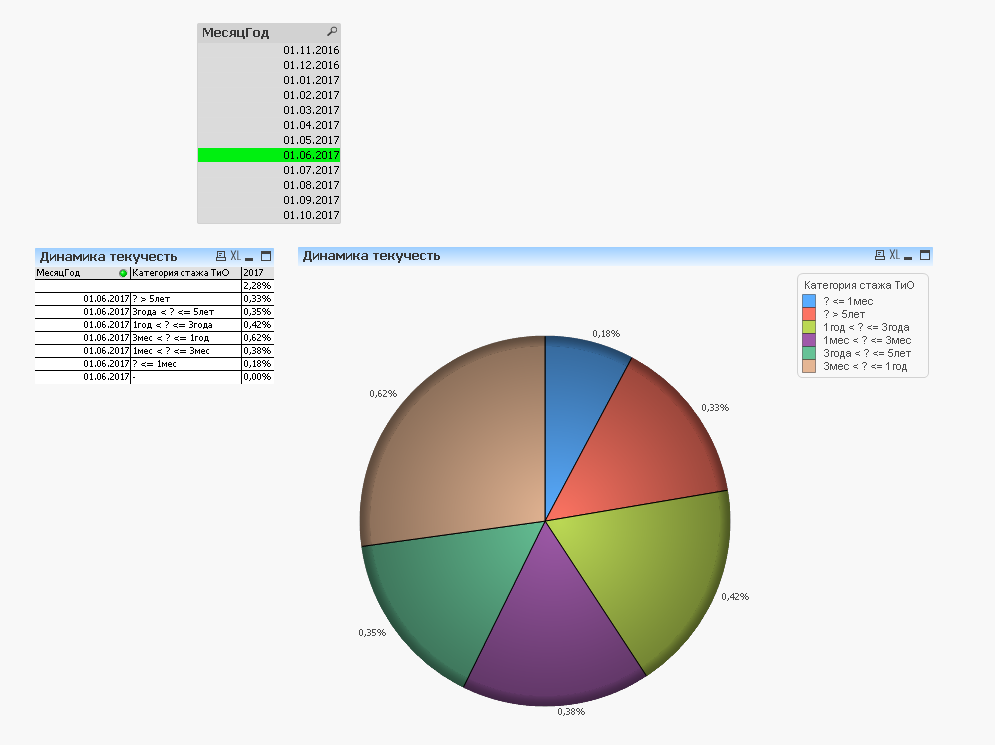
If the date is not selected, then the last, and when you select the date and this condition is, it will still be counted on the last of the selected dates?
For example: there are dates from January 2017 to October 2017, nothing is selected, the chart counts for October 2017, and if August 2017 is selected, then as of August 2017


- Mark as New
- Bookmark
- Subscribe
- Mute
- Subscribe to RSS Feed
- Permalink
- Report Inappropriate Content
Yes. It is possible. Would you be able to share the sample?
- Mark as New
- Bookmark
- Subscribe
- Mute
- Subscribe to RSS Feed
- Permalink
- Report Inappropriate Content
Hello!![]()
Yes of course, in your decision added a chart and when nothing is selected, it is necessary that it shows in the last month
- Mark as New
- Bookmark
- Subscribe
- Mute
- Subscribe to RSS Feed
- Permalink
- Report Inappropriate Content
there are multiple expressions for multiple conditions. Can you explain this expression?
- Mark as New
- Bookmark
- Subscribe
- Mute
- Subscribe to RSS Feed
- Permalink
- Report Inappropriate Content
in the table the first column is the number of laid-off workers broken down by length of service, the second column is the active number by months
in the diagram is the average number of employees relative to the dismissed.
the average number of employees (SSH) per month is:
SSH = SSH11 + SSH22, where
SSH11 = average value (the amount of active population for the current month + the amount of active population for the previous month)
SSH22 = average value (the amount of active population for the current month + the amount of active population for the next month)
as it is, this is a very complicated formula and it infuriates me too))![]()
- « Previous Replies
- Next Replies »