Unlock a world of possibilities! Login now and discover the exclusive benefits awaiting you.
Announcements
FLASH SALE: Save $500! Use code FLASH2026 at checkout until Feb 14th at 11:59PM ET. Register Now!
- Qlik Community
- :
- All Forums
- :
- QlikView App Dev
- :
- % in graphs
Options
- Subscribe to RSS Feed
- Mark Topic as New
- Mark Topic as Read
- Float this Topic for Current User
- Bookmark
- Subscribe
- Mute
- Printer Friendly Page
Turn on suggestions
Auto-suggest helps you quickly narrow down your search results by suggesting possible matches as you type.
Showing results for
Creator III
2018-01-22
09:06 AM
- Mark as New
- Bookmark
- Subscribe
- Mute
- Subscribe to RSS Feed
- Permalink
- Report Inappropriate Content
% in graphs
hello guys,
how to display %values in graphes ? thanks
Thanks
1,049 Views
1 Solution
Accepted Solutions
Partner - Creator III
2018-01-22
09:26 AM
- Mark as New
- Bookmark
- Subscribe
- Mute
- Subscribe to RSS Feed
- Permalink
- Report Inappropriate Content
Hi,
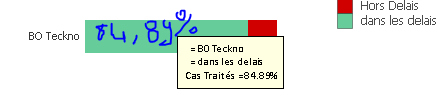
Check in the Expressions tab 'Values on data points' and then in the Presentation tab you check 'Plot values inside segments'
Good luck 
1,006 Views
4 Replies
2018-01-22
09:16 AM
- Mark as New
- Bookmark
- Subscribe
- Mute
- Subscribe to RSS Feed
- Permalink
- Report Inappropriate Content
So, you want this without measure? Can you please post sample
Best Anil, When applicable please mark the correct/appropriate replies as "solution" (you can mark up to 3 "solutions". Please LIKE threads if the provided solution is helpful
1,006 Views
Creator III
2018-01-22
09:20 AM
Author
- Mark as New
- Bookmark
- Subscribe
- Mute
- Subscribe to RSS Feed
- Permalink
- Report Inappropriate Content
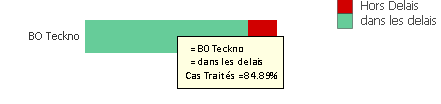
i want 84,8 to be displayed in the graph :
1,006 Views
2018-01-22
09:22 AM
- Mark as New
- Bookmark
- Subscribe
- Mute
- Subscribe to RSS Feed
- Permalink
- Report Inappropriate Content
Try to share sample to test
Best Anil, When applicable please mark the correct/appropriate replies as "solution" (you can mark up to 3 "solutions". Please LIKE threads if the provided solution is helpful
1,006 Views
Partner - Creator III
2018-01-22
09:26 AM
- Mark as New
- Bookmark
- Subscribe
- Mute
- Subscribe to RSS Feed
- Permalink
- Report Inappropriate Content
Hi,
Check in the Expressions tab 'Values on data points' and then in the Presentation tab you check 'Plot values inside segments'
Good luck
1,007 Views