Unlock a world of possibilities! Login now and discover the exclusive benefits awaiting you.
- Qlik Community
- :
- All Forums
- :
- QlikView App Dev
- :
- Re: line chart expression which involves aggregati...
- Subscribe to RSS Feed
- Mark Topic as New
- Mark Topic as Read
- Float this Topic for Current User
- Bookmark
- Subscribe
- Mute
- Printer Friendly Page
- Mark as New
- Bookmark
- Subscribe
- Mute
- Subscribe to RSS Feed
- Permalink
- Report Inappropriate Content
line chart expression which involves aggregation - not ignoring date selection
Hi All,
I am new to Qlikview and I hope someone helps me with this issue.
I am trying to get people count for all the Dates in a Line chart but I am not able to find a right expression which involves aggregation.
I tried below expression:
Sum(Aggr(FldPeopleCount, Year, Department, country )) => Peoplecount
This expression gives below line chart. A blue dot for FldPeopleCount (Aggregated) only for the current date(DateField) - 15/03/2013.
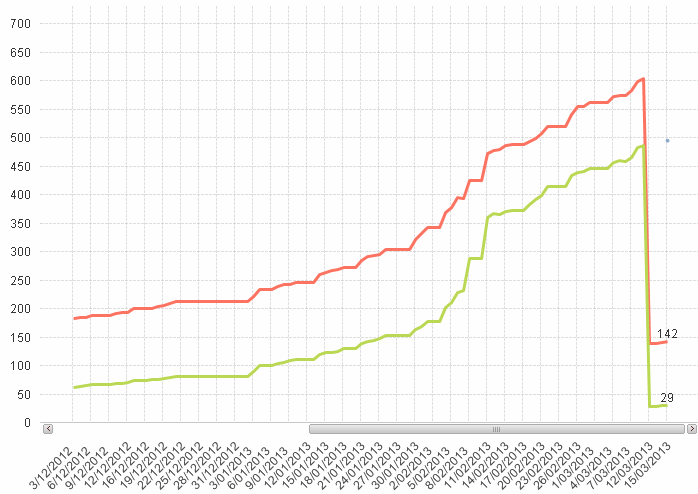
But I want Peoplecount for all the dates with aggregation for FldPeopleCount. Below is the required line chart which shows data for all the dates:
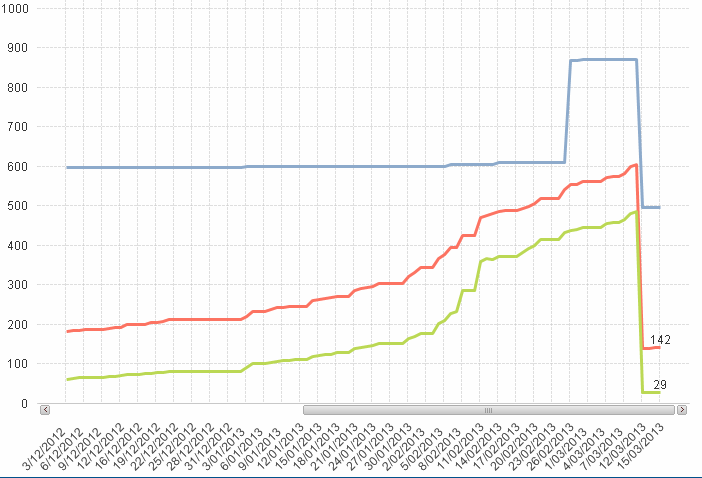
I have been trying many expressions but I am not able to find a correct expression which ignores date selection and gives the above graph.
Please help me with this expression. Thanks in advance!
- « Previous Replies
-
- 1
- 2
- Next Replies »
Accepted Solutions
- Mark as New
- Bookmark
- Subscribe
- Mute
- Subscribe to RSS Feed
- Permalink
- Report Inappropriate Content
Hi ,
Please find here below the attached file ,for your issue.
Regards,
Udit
- Mark as New
- Bookmark
- Subscribe
- Mute
- Subscribe to RSS Feed
- Permalink
- Report Inappropriate Content
Any suggestions ? I tried this expression. It did not work.
sum(Aggr(Sum({<DateFeild=>})FldPeopleCount), Year, Department, Country)
- Mark as New
- Bookmark
- Subscribe
- Mute
- Subscribe to RSS Feed
- Permalink
- Report Inappropriate Content
Hi dshreegiri,
try this expression,
sum(aggr(sum(FldpeopleCount)),datefield,year,department,country)
- Mark as New
- Bookmark
- Subscribe
- Mute
- Subscribe to RSS Feed
- Permalink
- Report Inappropriate Content
Hi nirmal,
Thanks for the reply.
It did not work. I want to ignore date selection. Your expression shows data for only the selected date.
- Mark as New
- Bookmark
- Subscribe
- Mute
- Subscribe to RSS Feed
- Permalink
- Report Inappropriate Content
ok try this
sum(Aggr(Sum({$<DateFeild=>})FldPeopleCount), Year, Department, Country)
- Mark as New
- Bookmark
- Subscribe
- Mute
- Subscribe to RSS Feed
- Permalink
- Report Inappropriate Content
dts not working
- Mark as New
- Bookmark
- Subscribe
- Mute
- Subscribe to RSS Feed
- Permalink
- Report Inappropriate Content
Can you upload your sample application
- Mark as New
- Bookmark
- Subscribe
- Mute
- Subscribe to RSS Feed
- Permalink
- Report Inappropriate Content
I dnt think I can upload that application it has some confidential information.
- Mark as New
- Bookmark
- Subscribe
- Mute
- Subscribe to RSS Feed
- Permalink
- Report Inappropriate Content
Iam asking just sample application
- Mark as New
- Bookmark
- Subscribe
- Mute
- Subscribe to RSS Feed
- Permalink
- Report Inappropriate Content
Sample application
- « Previous Replies
-
- 1
- 2
- Next Replies »