Unlock a world of possibilities! Login now and discover the exclusive benefits awaiting you.
- Qlik Community
- :
- All Forums
- :
- QlikView App Dev
- :
- Re: line chart issue
- Subscribe to RSS Feed
- Mark Topic as New
- Mark Topic as Read
- Float this Topic for Current User
- Bookmark
- Subscribe
- Mute
- Printer Friendly Page
- Mark as New
- Bookmark
- Subscribe
- Mute
- Subscribe to RSS Feed
- Permalink
- Report Inappropriate Content
line chart issue
Hi
i have year data i want to show line chart as
YTD Actuals+remaining months multiplyed by YTD Actuals Average
YTD Actuals=(10+20+30+40+50)/5= 30
Input:
Jan 10
Jan 10
Feb 20
Mar 30
Apr 40
May 50
jun 40
jul 50
aug 60
sep 90
oct 100
Nov 34
dec 45
Output Like this:
Jan 10
Feb 20
Mar 30
Apr 40
May 50
jun 30
jul 30
aug 30
sep 30
oct 30
Nov 30
dec 30
Please help thanks
- Mark as New
- Bookmark
- Subscribe
- Mute
- Subscribe to RSS Feed
- Permalink
- Report Inappropriate Content
You are looking to get this in the script or front end? Jan is repeating twice in your input table you provided, is this a typo or is this intentional?
- Mark as New
- Bookmark
- Subscribe
- Mute
- Subscribe to RSS Feed
- Permalink
- Report Inappropriate Content
I assume your MonthField values show a numeric representation, i.e. they've been created e.g. using Month() QV function.
Then you should be able to create your chart with dimension MonthField and maybe an expression like
=If(MonthField <= Month(Today() ),
Sum(Actuals),
Sum(TOTAL {<MonthField = {"<=$(=Month(Today()))"}>} Actuals) / Month(Today() )
)
- Mark as New
- Bookmark
- Subscribe
- Mute
- Subscribe to RSS Feed
- Permalink
- Report Inappropriate Content
Thanks its typo mistake Its Feb
If we can achevie I front end that's good otherwise back end also no issue
- Mark as New
- Bookmark
- Subscribe
- Mute
- Subscribe to RSS Feed
- Permalink
- Report Inappropriate Content
Have you checked out the expression provided by Stefan below? It is a front end option and you might want to check it out
- Mark as New
- Bookmark
- Subscribe
- Mute
- Subscribe to RSS Feed
- Permalink
- Report Inappropriate Content
I was not able to make Stefan's expression work even after a having a numeric representation for Month, but I used the same idea and used the date instead of Month.
Script:
Table:
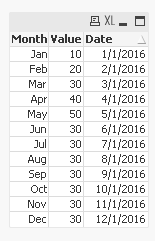
LOAD Month(Date#(Month, 'MMM')) as Month,
Value,
Date(Date) as Date;
LOAD * Inline [
Month, Value, Date
Jan, 10, 01/01/2016
Feb, 20, 02/01/2016
Mar, 30, 03/01/2016
Apr, 40, 04/01/2016
May, 50, 05/01/2016
Jun, 40, 06/01/2016
Jul, 50, 07/01/2016
Aug, 60, 08/01/2016
Sep, 90, 09/01/2016
Oct, 100, 10/01/2016
Nov, 34, 11/01/2016
Dec, 45, 12/01/2016
];
Create a chart with Month as dimension and the following Expression:
=If(Month <= Month(Today()), Sum(Value), Avg(TOTAL {<Date = {"$(='>=' & YearStart(Max(Date)) & '<=' & MonthEnd(Today()))"}>} Value))

I have created Date(Date) as Date in the script, so I did not have to use Date() function to fix my formatting in the set analysis expression here
Date = {"$(='>=' & YearStart(Max(Date)) & '<=' & MonthEnd(Today()))"}
But in case your date format is something else, you might need to fix the format like this:
Date = {"$(='>=' & Date(YearStart(Max(Date)), 'DateFieldFormatHere') & '<=' & Date(MonthEnd(Today()), 'DateFieldFormatHere'))"}
- Mark as New
- Bookmark
- Subscribe
- Mute
- Subscribe to RSS Feed
- Permalink
- Report Inappropriate Content
Seems like in this & my case, we need to use
=If(Month <= Month(Today()), Sum(Value), SUm(TOTAL {<Month = {"$(='<=' & Num(Month(today())))"}>} Value) /Month(today()))
Note that there is a difference between my and Sunny's expression if you are using data for more than 1 year, without having year selected. But if you are really interested in CY to date, you then need to also limit the first Sum(). I also would be careful to use Avg() here, in case you are using more than one record per Month. And in case you have more than 1 year of data and future dates also, but you are only interested in CY to date, use also today() in the lower limit of the advanced search:
=If(Month <= Month(Today()),
Sum( {<Date = {"$(='>=' & YearStart(Today()) & '<=' & MonthEnd(Today()))"}>} Value),
Sum(TOTAL {<Date = {"$(='>=' & YearStart(Today()) & '<=' & MonthEnd(Today()))"}>} Value) / Month(Today())
)
or
=If(Month <= Month(Today()),
Sum({<Year = {$(=Year(today()))},Date=>}Value),
Sum(TOTAL {<Month = {"$(='<=' & Num(Month(today())))"},Year = {$(=Year(today()))}, Date>} Value)/Month(today())
)
[Having created an additional Year field in the model]
You see, it's getting slightly into using more and more set analysis depending on your real setting and requirements.
- Mark as New
- Bookmark
- Subscribe
- Mute
- Subscribe to RSS Feed
- Permalink
- Report Inappropriate Content
thanks ,
is there any way to implement in Back end script in front end i have lot of expressions
- Mark as New
- Bookmark
- Subscribe
- Mute
- Subscribe to RSS Feed
- Permalink
- Report Inappropriate Content
For backend, you can try like this:
Table:
LOAD Month(Date#(Month, 'MMM')) as Month,
Value,
Date(Date) as Date;
LOAD * Inline [
Month, Value, Date
Jan, 10, 01/01/2016
Feb, 20, 02/01/2016
Mar, 30, 03/01/2016
Apr, 40, 04/01/2016
May, 50, 05/01/2016
Jun, 40, 06/01/2016
Jul, 50, 07/01/2016
Aug, 60, 08/01/2016
Sep, 90, 09/01/2016
Oct, 100, 10/01/2016
Nov, 34, 11/01/2016
Dec, 45, 12/01/2016
];
Left Join(Table)
LOAD Avg(Value) as Avg
Resident Table
Where Date <= MonthEnd(Today());
FinalTable:
NoConcatenate
LOAD Date,
Month,
If(Date <= MonthEnd(Today()), Value, Avg) as Value
Resident Table;
DROP Table Table;
- Mark as New
- Bookmark
- Subscribe
- Mute
- Subscribe to RSS Feed
- Permalink
- Report Inappropriate Content
There are multiple ways to achieve what you want, the best way can only be determined when knowing more details about your data and requirement.
Here is an approach with a single table load:
Table:
LOAD *, If(Month(Today()) >= Month, Value, Acc / Month(Today())) as NewValue;
LOAD *, Rangesum(Peek('Acc'),If(Month(Today()) >= Month,Value)) as Acc;
LOAD Month(Date#(Month, 'MMM')) as Month,
Value,
Date(Date) as Date;
LOAD * Inline [
Month, Value, Date
Jan, 10, 01/01/2016
Feb, 20, 02/01/2016
Mar, 30, 03/01/2016
Apr, 40, 04/01/2016
May, 50, 05/01/2016
Jun, 40, 06/01/2016
Jul, 50, 07/01/2016
Aug, 60, 08/01/2016
Sep, 90, 09/01/2016
Oct, 100, 10/01/2016
Nov, 34, 11/01/2016
Dec, 45, 12/01/2016
];