Unlock a world of possibilities! Login now and discover the exclusive benefits awaiting you.
- Qlik Community
- :
- All Forums
- :
- QlikView App Dev
- :
- Re: line chart style
- Subscribe to RSS Feed
- Mark Topic as New
- Mark Topic as Read
- Float this Topic for Current User
- Bookmark
- Subscribe
- Mute
- Printer Friendly Page
- Mark as New
- Bookmark
- Subscribe
- Mute
- Subscribe to RSS Feed
- Permalink
- Report Inappropriate Content
line chart style
Hi,
I try to do a line chart style like this example:

I cannot put a different color/shade below the line.
Any idea?
Thanks a lot,
Eva
- « Previous Replies
-
- 1
- 2
- Next Replies »
Accepted Solutions
- Mark as New
- Bookmark
- Subscribe
- Mute
- Subscribe to RSS Feed
- Permalink
- Report Inappropriate Content
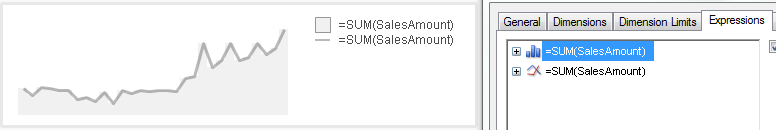
Ok I did in with an overlay of 2 graphs. 1 area, the other one in line with a transparent background.
It's working but it's not a really elegant technical solution...
- Mark as New
- Bookmark
- Subscribe
- Mute
- Subscribe to RSS Feed
- Permalink
- Report Inappropriate Content
Hi,
Go to chart properties --> colors tab --> and change color of first element.
Look at the attached image.
Or post your sample data.
Regards
ASHFAQ
- Mark as New
- Bookmark
- Subscribe
- Mute
- Subscribe to RSS Feed
- Permalink
- Report Inappropriate Content
Hi Eva,
I think this is not possible in Qlikview .
.
Regards,
@vi
- Mark as New
- Bookmark
- Subscribe
- Mute
- Subscribe to RSS Feed
- Permalink
- Report Inappropriate Content
 Hi Guys,
Thanks for your answer!
ASHFAQ : it will change the line color, but not fill below.
What I did so far...
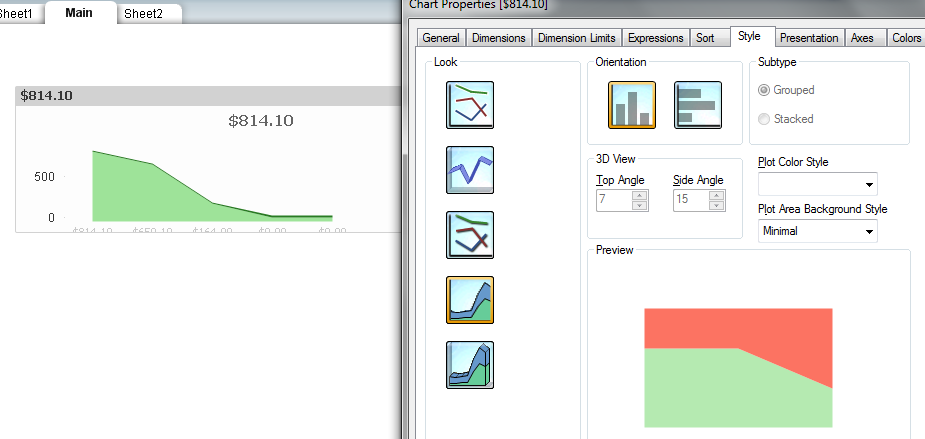
on the sheet style, pick up the pen ultimate style.
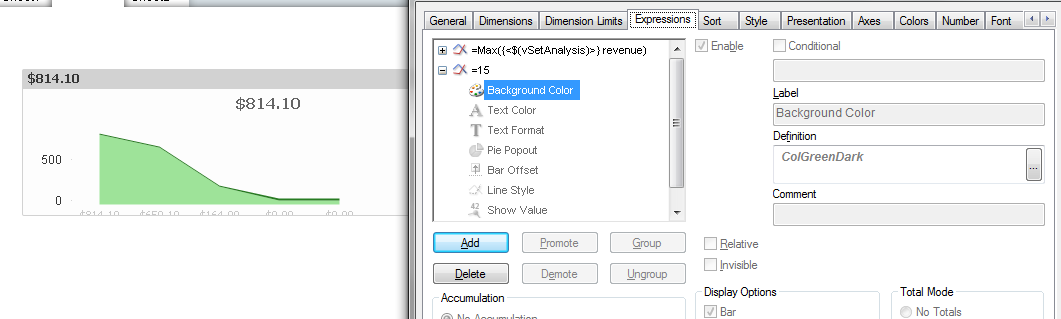
On the sheet expressions -> add an expression =15 with a daker background.
It almost works but: 1 it's not really good practice/dev. 2 the resultat is not really beautiful when the scale, size change.
Any other idea?
- Mark as New
- Bookmark
- Subscribe
- Mute
- Subscribe to RSS Feed
- Permalink
- Report Inappropriate Content
Hi,
Convert the chart to an Area Chart and see.
thanx
- Mark as New
- Bookmark
- Subscribe
- Mute
- Subscribe to RSS Feed
- Permalink
- Report Inappropriate Content
Do you know how to get 2 shades with the area. I sidestep QV with 2 expressions. but the rendering is not perfect.
I just added 2 print screens to my previous post.
- Mark as New
- Bookmark
- Subscribe
- Mute
- Subscribe to RSS Feed
- Permalink
- Report Inappropriate Content
Hi,
Try selecting your preferred colors under Color --- > Color Scheme 1-6
thanx
- Mark as New
- Bookmark
- Subscribe
- Mute
- Subscribe to RSS Feed
- Permalink
- Report Inappropriate Content
I cannot make it. colors on the colors sheet allow me to change the line/area with 1 color or a gradiant but not to separate colors.
- Mark as New
- Bookmark
- Subscribe
- Mute
- Subscribe to RSS Feed
- Permalink
- Report Inappropriate Content
Ok I did in with an overlay of 2 graphs. 1 area, the other one in line with a transparent background.
It's working but it's not a really elegant technical solution...
- Mark as New
- Bookmark
- Subscribe
- Mute
- Subscribe to RSS Feed
- Permalink
- Report Inappropriate Content
Hi Eva,
As the combo chart doesn't allow line and area you're best option is the transparent overlay you've used. An alternative (which will depend on the granularity of your dimension) may be to use the bar and line combo. Again this isn't an elegant solution but you'll have less layout issues than the overlay.
- « Previous Replies
-
- 1
- 2
- Next Replies »