Unlock a world of possibilities! Login now and discover the exclusive benefits awaiting you.
- Qlik Community
- :
- All Forums
- :
- QlikView App Dev
- :
- Re: linear gauge mini chart not display unless col...
- Subscribe to RSS Feed
- Mark Topic as New
- Mark Topic as Read
- Float this Topic for Current User
- Bookmark
- Subscribe
- Mute
- Printer Friendly Page
- Mark as New
- Bookmark
- Subscribe
- Mute
- Subscribe to RSS Feed
- Permalink
- Report Inappropriate Content
linear gauge mini chart not display unless column width increased greatly
Hi All,
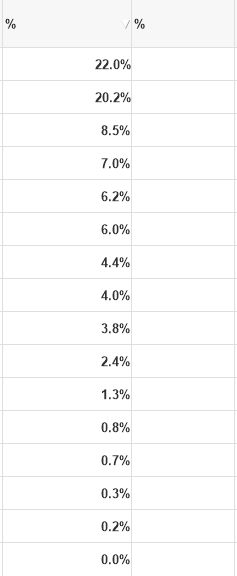
The mini chart linear gauge is not displaying unless I greatly increase the column width, and it appears to be very compressed. Which settings control this?
Normal Width Does Not Display:
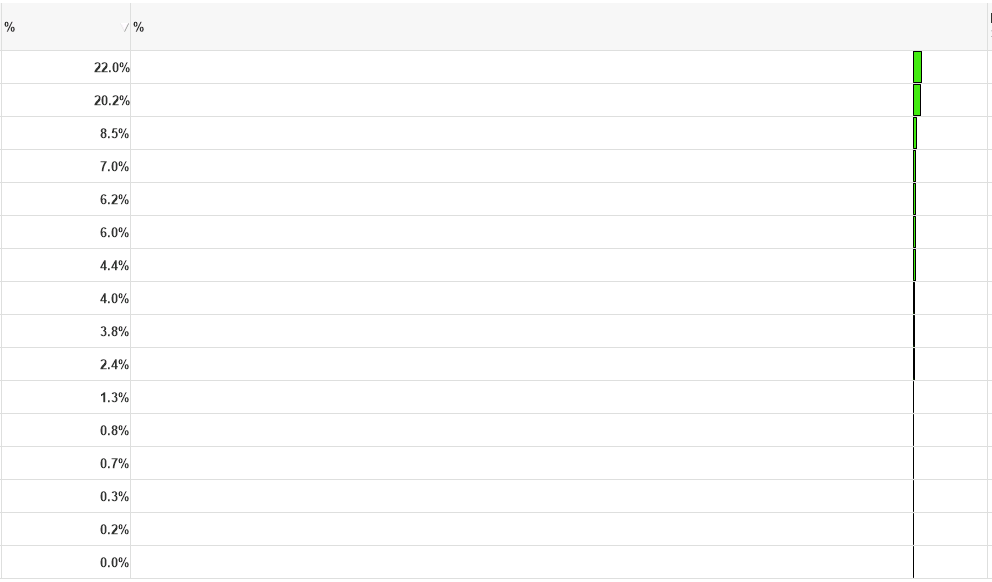
Greatly Increase Width and Displays but Compressed:
Thanks!
- « Previous Replies
-
- 1
- 2
- Next Replies »
- Mark as New
- Bookmark
- Subscribe
- Mute
- Subscribe to RSS Feed
- Permalink
- Report Inappropriate Content
Can you check the "Relative Segment Bounds"
- Mark as New
- Bookmark
- Subscribe
- Mute
- Subscribe to RSS Feed
- Permalink
- Report Inappropriate Content
I tried this and it doesn't appear to make a difference. Still only displaying if column width is kept wide
- Mark as New
- Bookmark
- Subscribe
- Mute
- Subscribe to RSS Feed
- Permalink
- Report Inappropriate Content
Would you mine, Can you attach sample file t test
- Mark as New
- Bookmark
- Subscribe
- Mute
- Subscribe to RSS Feed
- Permalink
- Report Inappropriate Content
Unfortunately I don't have a sample file and I can't share the data. Would any other information about expressions or selections in the Chart Properties help?
- Mark as New
- Bookmark
- Subscribe
- Mute
- Subscribe to RSS Feed
- Permalink
- Report Inappropriate Content
Are you trying to fill the Linear graph column to adjust from out of 100%? If so, I believe don't needed any other instead of options
- Mark as New
- Bookmark
- Subscribe
- Mute
- Subscribe to RSS Feed
- Permalink
- Report Inappropriate Content
I'm basically trying to show % shown in the first column as a bar in the second column - so essentially trying to make a horizontal bar chart within a straight table of the %s shown in first colum. You don't believe any other options are needed and no ideas why the bar is starting so far to the end of the wide column? I want the bar to start at the beginning of the left side of the column
- Mark as New
- Bookmark
- Subscribe
- Mute
- Subscribe to RSS Feed
- Permalink
- Report Inappropriate Content
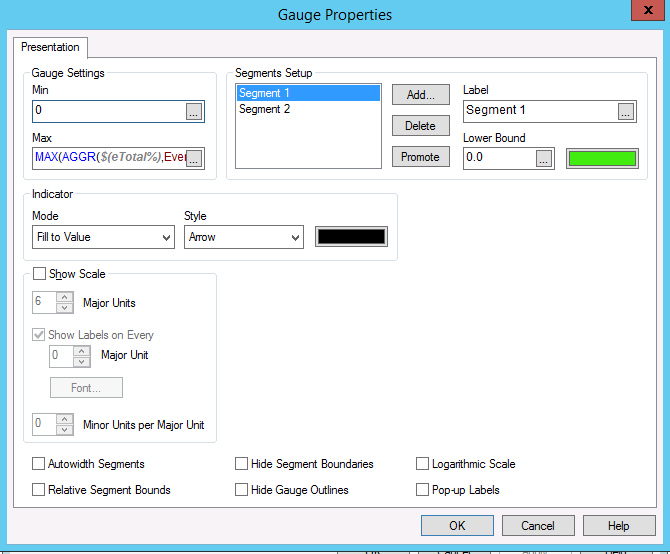
Gauge setting should be each bound like 0.0 and 0.5 for two bounds..
- Mark as New
- Bookmark
- Subscribe
- Mute
- Subscribe to RSS Feed
- Permalink
- Report Inappropriate Content
Yes, segment 1 is 0.0 and segment 2 is 0.5. I have tried Min=0 and Max=1 OR Min=0 and Max=MAX(AGGR($(eTotal%),Event))
- Mark as New
- Bookmark
- Subscribe
- Mute
- Subscribe to RSS Feed
- Permalink
- Report Inappropriate Content
Can you make mockup
- « Previous Replies
-
- 1
- 2
- Next Replies »