Unlock a world of possibilities! Login now and discover the exclusive benefits awaiting you.
- Qlik Community
- :
- All Forums
- :
- QlikView App Dev
- :
- Re: looking for change in expression
- Subscribe to RSS Feed
- Mark Topic as New
- Mark Topic as Read
- Float this Topic for Current User
- Bookmark
- Subscribe
- Mute
- Printer Friendly Page
- Mark as New
- Bookmark
- Subscribe
- Mute
- Subscribe to RSS Feed
- Permalink
- Report Inappropriate Content
looking for change in expression
Hello
my requiremnt is to show % of each decision filed value of same supplier ,to achieve this in a bar chart
i took dimension: 1)name1 //(supplier name filed)
2)decision //(accepted,rejected,exception)
and expression i wrote is:
count({$<YEAR= , Quarter=, ENSTEHDAT={">=$(vFromdate)<=$(vTodate)"}>} PRUEFLOS)
/count({$<YEAR=,Quarter=, ENSTEHDAT={">=$(vFromdate)<=$(vTodate)"}>} Total <name1> PRUEFLOS)
so problem is while i am showing all the supplier i am getting different values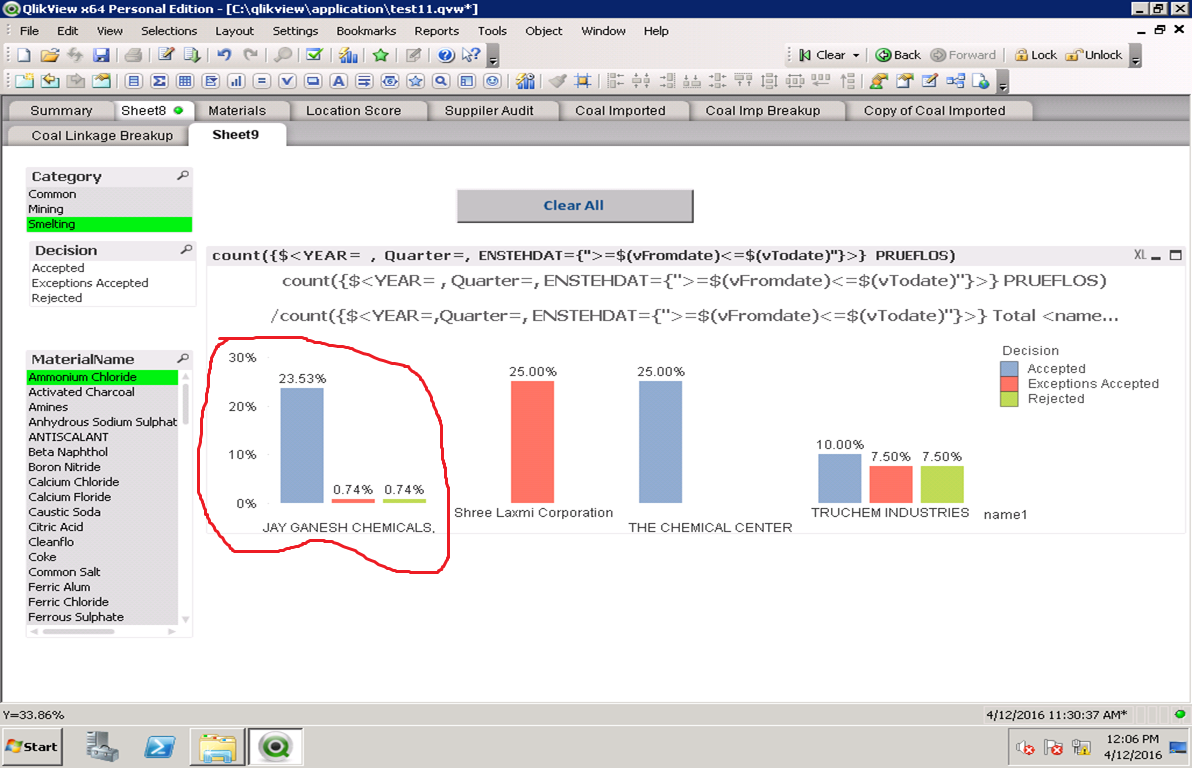
but if i choose one supplier then i am able to get what i am looking
this is what i am looking ,so i think i need to do a changes in my expression ,any one suggest me what changes should i need to do plz
- Mark as New
- Bookmark
- Subscribe
- Mute
- Subscribe to RSS Feed
- Permalink
- Report Inappropriate Content
the issues is when u select a value from decision field (Accepted,Rejected,Exception Accepted),
if you select either then it giving only 100% as output
- Mark as New
- Bookmark
- Subscribe
- Mute
- Subscribe to RSS Feed
- Permalink
- Report Inappropriate Content
What do you expect to see when you select Decision?
- Mark as New
- Bookmark
- Subscribe
- Mute
- Subscribe to RSS Feed
- Permalink
- Report Inappropriate Content
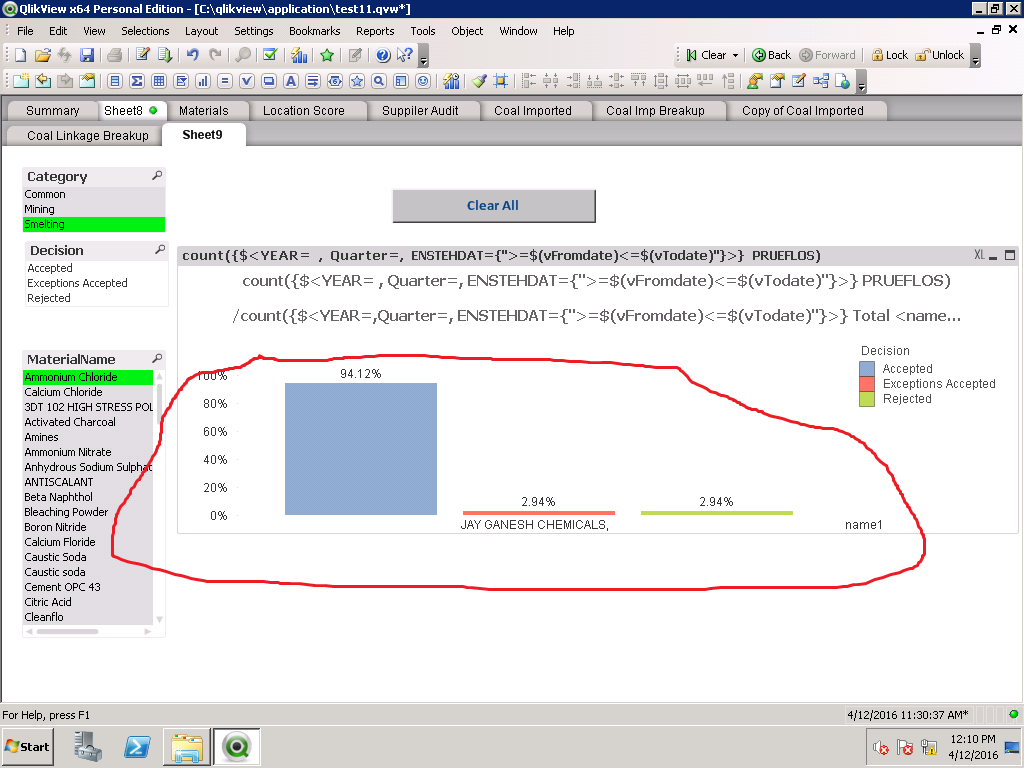
Actually i am looking for this out put ,see that JAY GANESH CHEMICAL


- Mark as New
- Bookmark
- Subscribe
- Mute
- Subscribe to RSS Feed
- Permalink
- Report Inappropriate Content
Try this expression:
count({$<YEAR= , Quarter=, ENSTEHDAT={">=$(vFromdate)<=$(vTodate)"}, Decision>} PRUEFLOS)
/count({$<YEAR=,Quarter=, ENSTEHDAT={">=$(vFromdate)<=$(vTodate)"}, Decision>} Total <name1> PRUEFLOS) * Avg(1)
- Mark as New
- Bookmark
- Subscribe
- Mute
- Subscribe to RSS Feed
- Permalink
- Report Inappropriate Content
YOU DID IT my friend ,
I was looking for this o/p from last 3 days,thank you very very much,
any chance to explain what does Avg(1) dose
- Mark as New
- Bookmark
- Subscribe
- Mute
- Subscribe to RSS Feed
- Permalink
- Report Inappropriate Content
The reason I had to add that was because if you remove that, then based on your selection in Decision field you would still see all the three decision types because we are restricting it using set analysis. By multiplying it with Avg(1) which is not restricted by any set analysis, I am indirectly filtering out decisions which are not selected. Learnt this technique recently from master of QlikView swuehl and have been showing it off everywhere ever since.
I would suggest you to spend some time and mark some helpful answers as a lot of people spent their valuable time helping you out. The idea is to select helpful answers which you believe will help other people when they look at this thread in the future.
Thanks,
Sunny
- Mark as New
- Bookmark
- Subscribe
- Mute
- Subscribe to RSS Feed
- Permalink
- Report Inappropriate Content
Hello,
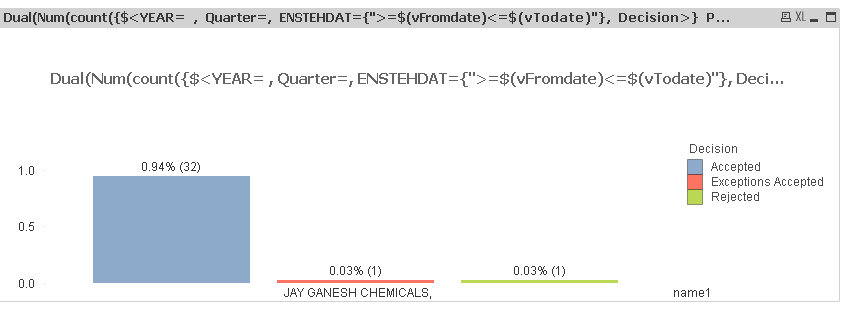
is it possible to show values along with this percentage on same bar ,currently i am showing only percentage
- Mark as New
- Bookmark
- Subscribe
- Mute
- Subscribe to RSS Feed
- Permalink
- Report Inappropriate Content
Try this:
Dual(Num(count({$<YEAR= , Quarter=, ENSTEHDAT={">=$(vFromdate)<=$(vTodate)"}, Decision>} PRUEFLOS)
/count({$<YEAR=,Quarter=, ENSTEHDAT={">=$(vFromdate)<=$(vTodate)"}, Decision>} Total <name1> PRUEFLOS) * Avg(1), '##.##% (') &
Num(count({$<YEAR= , Quarter=, ENSTEHDAT={">=$(vFromdate)<=$(vTodate)"}, Decision>} PRUEFLOS) * Avg(1), '##)'),
count({$<YEAR= , Quarter=, ENSTEHDAT={">=$(vFromdate)<=$(vTodate)"}, Decision>} PRUEFLOS)
/count({$<YEAR=,Quarter=, ENSTEHDAT={">=$(vFromdate)<=$(vTodate)"}, Decision>} Total <name1> PRUEFLOS) * Avg(1))
Change format to expression default on Number tab
- Mark as New
- Bookmark
- Subscribe
- Mute
- Subscribe to RSS Feed
- Permalink
- Report Inappropriate Content
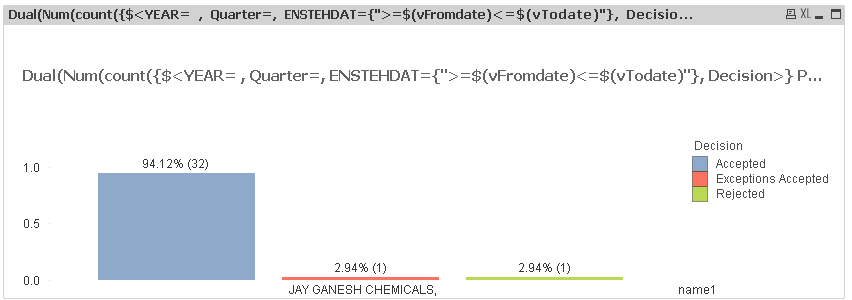
is it possible to get % like this
JAY GANESH CHEMICAL: accepted :94.12%( instead of 0.94%)
rejected :2.94%( instead of 0.03%)
exception :2.94%( instead of 0.03%)
- Mark as New
- Bookmark
- Subscribe
- Mute
- Subscribe to RSS Feed
- Permalink
- Report Inappropriate Content
My bad, try this:
Dual(Num(count({$<YEAR= , Quarter=, ENSTEHDAT={">=$(vFromdate)<=$(vTodate)"}, Decision>} PRUEFLOS)
/count({$<YEAR=,Quarter=, ENSTEHDAT={">=$(vFromdate)<=$(vTodate)"}, Decision>} Total <name1> PRUEFLOS) * Avg(1) * 100, '##.##% (') &
Num(count({$<YEAR= , Quarter=, ENSTEHDAT={">=$(vFromdate)<=$(vTodate)"}, Decision>} PRUEFLOS) * Avg(1), '##)'),
count({$<YEAR= , Quarter=, ENSTEHDAT={">=$(vFromdate)<=$(vTodate)"}, Decision>} PRUEFLOS)
/count({$<YEAR=,Quarter=, ENSTEHDAT={">=$(vFromdate)<=$(vTodate)"}, Decision>} Total <name1> PRUEFLOS) * Avg(1))
Dual(Num(count({$<YEAR= , Quarter=, ENSTEHDAT={">=$(vFromdate)<=$(vTodate)"}, Decision>} PRUEFLOS)
/count({$<YEAR=,Quarter=, ENSTEHDAT={">=$(vFromdate)<=$(vTodate)"}, Decision>} Total <name1> PRUEFLOS) * Avg(100), '##.##% (') &
Num(count({$<YEAR= , Quarter=, ENSTEHDAT={">=$(vFromdate)<=$(vTodate)"}, Decision>} PRUEFLOS) * Avg(1), '##)'),
count({$<YEAR= , Quarter=, ENSTEHDAT={">=$(vFromdate)<=$(vTodate)"}, Decision>} PRUEFLOS)
/count({$<YEAR=,Quarter=, ENSTEHDAT={">=$(vFromdate)<=$(vTodate)"}, Decision>} Total <name1> PRUEFLOS) * Avg(1))