Unlock a world of possibilities! Login now and discover the exclusive benefits awaiting you.
- Qlik Community
- :
- All Forums
- :
- QlikView App Dev
- :
- missing values on data points
- Subscribe to RSS Feed
- Mark Topic as New
- Mark Topic as Read
- Float this Topic for Current User
- Bookmark
- Subscribe
- Mute
- Printer Friendly Page
- Mark as New
- Bookmark
- Subscribe
- Mute
- Subscribe to RSS Feed
- Permalink
- Report Inappropriate Content
missing values on data points
Hi,
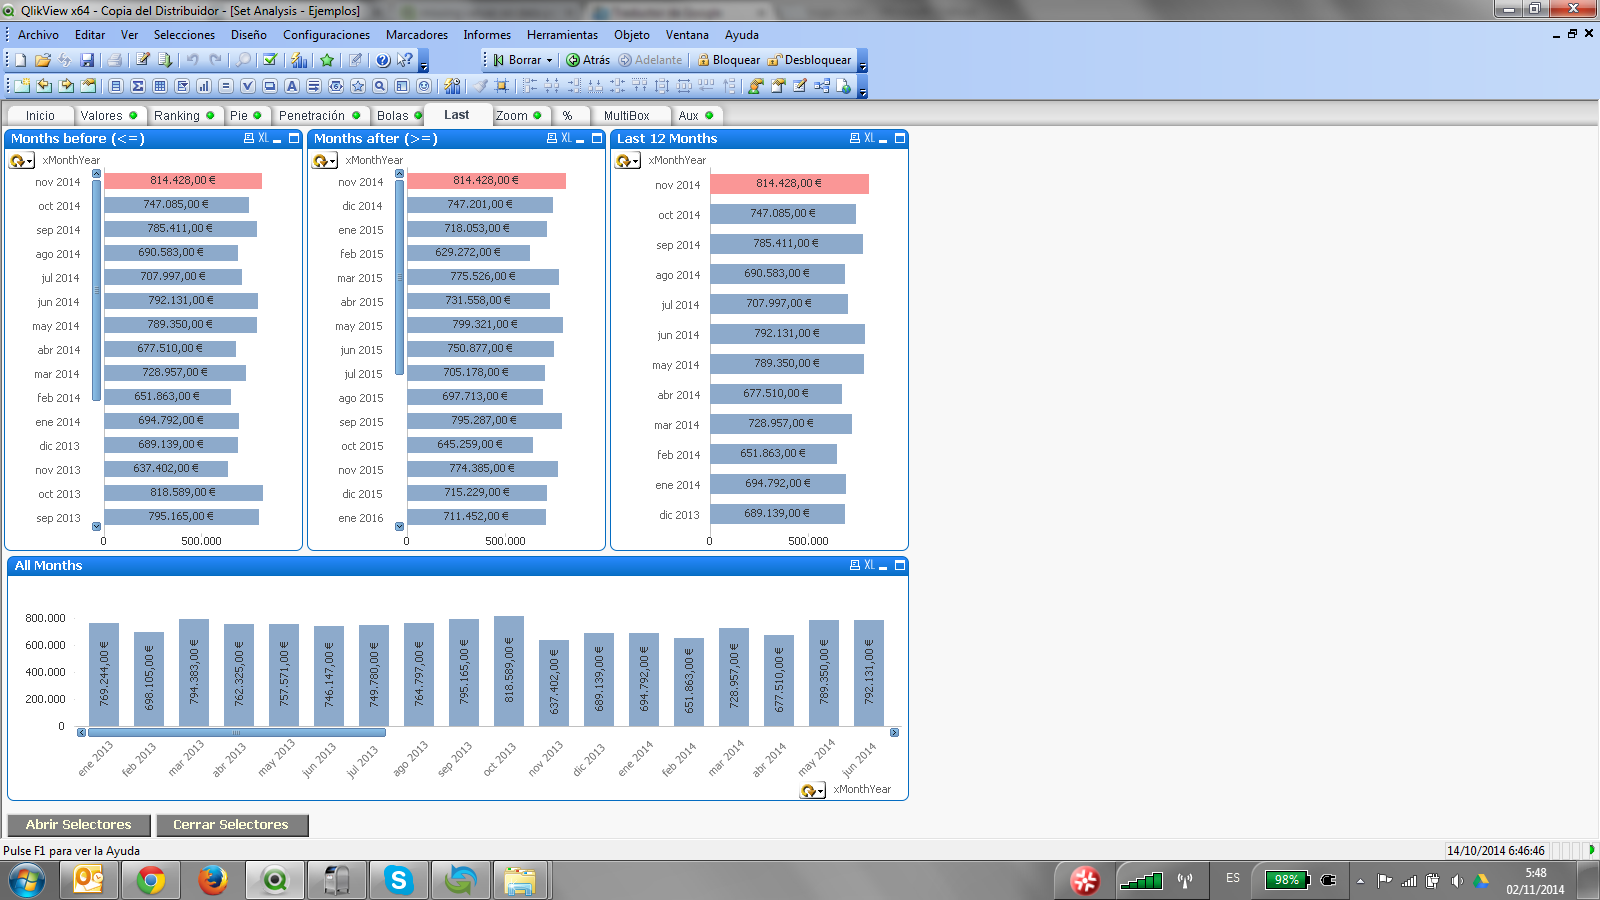
I have a formatting problem with my bar charts, some of the values are not shown on the data points and it seems like it affects those where the bar is too small to fit the text. When I uncheck the box "Plot values inside segments" all values are shown but it shrinks the chart.
Any idea how I can still show the numbers inside the bars and just overlap if there is not enough space? Or maybe an other good solution?
Show screenshot in the attachment.
Thanks in advance.
- Mark as New
- Bookmark
- Subscribe
- Mute
- Subscribe to RSS Feed
- Permalink
- Report Inappropriate Content
one solution would be for you to change the graphics to a horizontal orientation and data were to appear in the chart bars
- Mark as New
- Bookmark
- Subscribe
- Mute
- Subscribe to RSS Feed
- Permalink
- Report Inappropriate Content
Hello Nichols,
Enrique's answer is the best way to do it. You can also try this way
Uncheck the Values on Data Points option and write a calculated dimension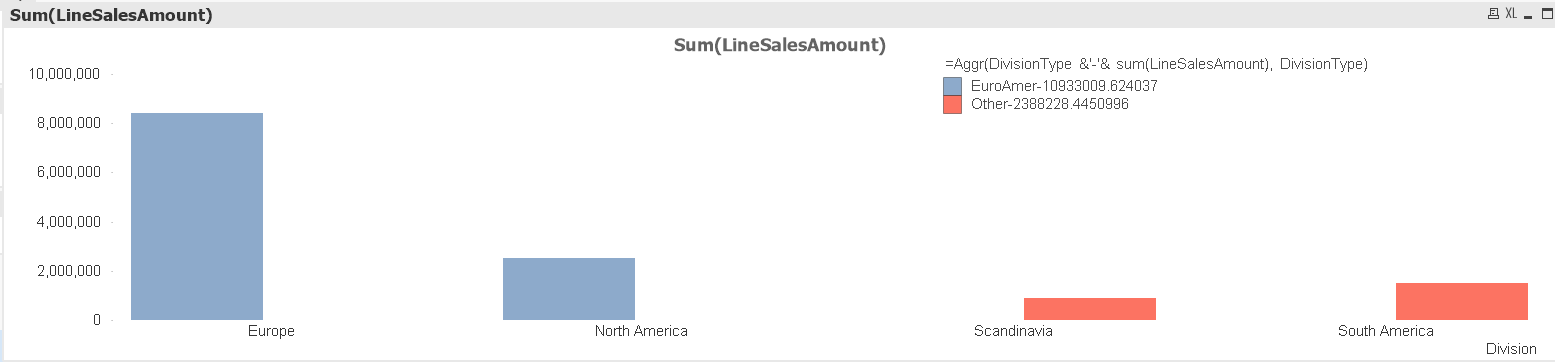 as shown
- Mark as New
- Bookmark
- Subscribe
- Mute
- Subscribe to RSS Feed
- Permalink
- Report Inappropriate Content
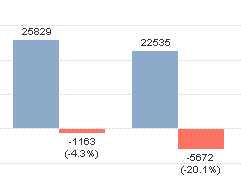
Thank you both for the input! "Horizontal" was the key word I guess  I have to keep the orientation of the charts as is unfortunately, but I changed the values on top of the bars to be horizontal instead of vertical which makes a lot of difference since it doesn't really shrink the bars.
Check it out: