Unlock a world of possibilities! Login now and discover the exclusive benefits awaiting you.
- Qlik Community
- :
- All Forums
- :
- QlikView App Dev
- :
- need help with (grid-?) chart
- Subscribe to RSS Feed
- Mark Topic as New
- Mark Topic as Read
- Float this Topic for Current User
- Bookmark
- Subscribe
- Mute
- Printer Friendly Page
- Mark as New
- Bookmark
- Subscribe
- Mute
- Subscribe to RSS Feed
- Permalink
- Report Inappropriate Content
need help with (grid-?) chart
Hi there,
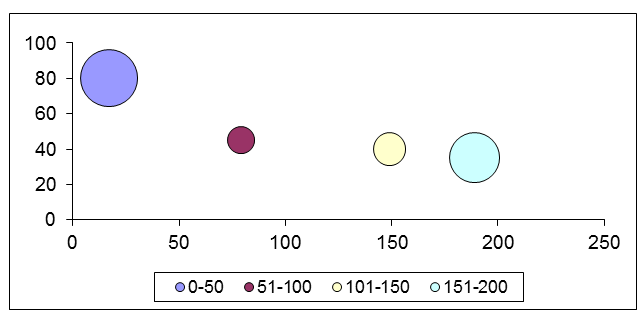
I was asked to create a (grid-?) chart with the following dimensions:
x-axis:
- price range [0-50, 51-100, 101-150, 151-200 for example]
y-axis:
- some kind of ratio (0-100%)
All that in the relation to a total number.
Here is an example:
The data table is roughly:
- id (int)
- range (text)
- accepted (bool)
If I have the two dimensions "range" and the calculated dimension "sum(accepted)/count(id)" I always get an "error in calculated dimension".
Does anyone know how to solve that problem?
Any help is appreciated.
Accepted Solutions
- Mark as New
- Bookmark
- Subscribe
- Mute
- Subscribe to RSS Feed
- Permalink
- Report Inappropriate Content
In the calculated dimension, you have to use Aggr() alongwith any aggregation function. Hence, try like:
Aggr(sum(accepted), Dim1) /Aggr(count(id), Dim1)
- Mark as New
- Bookmark
- Subscribe
- Mute
- Subscribe to RSS Feed
- Permalink
- Report Inappropriate Content
In the calculated dimension, you have to use Aggr() alongwith any aggregation function. Hence, try like:
Aggr(sum(accepted), Dim1) /Aggr(count(id), Dim1)
- Mark as New
- Bookmark
- Subscribe
- Mute
- Subscribe to RSS Feed
- Permalink
- Report Inappropriate Content
sum(accepted)/count(id) this the error for the "Error in calculated dimension" we cannot use this kind of calculation in dimension unless it will calculate using AGGR fundtion.
Try like aggr(sum(accepted)/count(id),calculation_on_dimension_required)
if you share the exact requirement we can help you
- Mark as New
- Bookmark
- Subscribe
- Mute
- Subscribe to RSS Feed
- Permalink
- Report Inappropriate Content
Hi the both of you!
Your help really pointed me to the result I was looking for.
Thanks a lot for your help!!!!
- Mark as New
- Bookmark
- Subscribe
- Mute
- Subscribe to RSS Feed
- Permalink
- Report Inappropriate Content
mark the helpful and correct answers 
- Mark as New
- Bookmark
- Subscribe
- Mute
- Subscribe to RSS Feed
- Permalink
- Report Inappropriate Content
Hi again,
I would like to add a question to the upper part.
The scale for the y-axis is in percent but it is always autoscaling (e.g. max val is 60% so it ends with 60%).
Within the properties --> axes setting I can not edit the "static max" value.
Does anyone know how I can change it so that the y-axis is always showing 100%?
Thanks and regards