Unlock a world of possibilities! Login now and discover the exclusive benefits awaiting you.
- Qlik Community
- :
- All Forums
- :
- QlikView App Dev
- :
- need help
- Subscribe to RSS Feed
- Mark Topic as New
- Mark Topic as Read
- Float this Topic for Current User
- Bookmark
- Subscribe
- Mute
- Printer Friendly Page
- Mark as New
- Bookmark
- Subscribe
- Mute
- Subscribe to RSS Feed
- Permalink
- Report Inappropriate Content
need help
i have one date column , with that i created one master calender, but in the chart it is not displaying.
in dimension i kept as region
and in the espression i kept as = NUM(AVG(MID(THRESHOLD,3,len(THRESHOLD)-3))/100,'#,##0.0%')
i want to associate with master calender year , month
how can i associate
for another dashbaord i have master calender in which my expression as
count(distinct{<Type ={'I'},IN_OPEN_DATE>}Ticket)
here i kept OPEN_DATE
can anyone please help how ca keep in the exp NUM(AVG(MID(THRESHOLD,3,len(THRESHOLD)-3))/100,'#,##0.0%')
- Mark as New
- Bookmark
- Subscribe
- Mute
- Subscribe to RSS Feed
- Permalink
- Report Inappropriate Content
May be this?
NUM(AVG({<IN_OPEN_DATE=>} MID(THRESHOLD,3,len(THRESHOLD)-3))/100,'#,##0.0%')
- Mark as New
- Bookmark
- Subscribe
- Mute
- Subscribe to RSS Feed
- Permalink
- Report Inappropriate Content
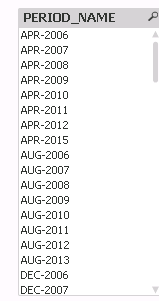
My original date filed is this
PERIOD_NAME

I kept in the load script as
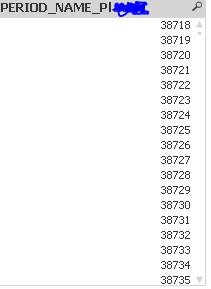
Floor(Num(DATE(PERIOD_NAME))) as PERIOD_NAME_Pl,

After that in master calender i have cretaed in the script as below
TempCalendar:
LOAD
$(vMinDate) + Iterno()-1 As Num,
Date($(vMinDate) + IterNo() - 1) as TempDate
AutoGenerate 1 While $(vMinDate) + IterNo() -1 <= $(vMaxDate);
OutageStartDateCal_pl:
Load
Num AS PERIOD_NAME_Pl,
week(TempDate) As OutageStartDateCal.Week_pl,
Year(TempDate) As OutageStartDateCal.Year_pl,
Month(TempDate) As OutageStartDateCal.Month_pl,
Day(TempDate) As OutageStartDateCal.Day_pl,
num(TempDate) AS DateNum_PL_pl,
week(TempDate) AS Week_PL_pl,
Year(TempDate) AS Year_PL_pl,
Month(TempDate) AS Month_PL_pl,
Day(TempDate) AS Day_PLpl ,
ApplyMap('QuartersMap', month(TempDate), Null()) as OutageStartDateCal.Quarter_pl,
Week(weekstart(TempDate)) & '-' & WeekYear(TempDate) as OutageStartDateCal.WeekYear_pl,
WeekDay(TempDate) as OutageStartDateCal.WeekDay_pl,
if(InYearToDate(TempDate, today(),0), 1, 0) as OutageStartDateCal.CurYearFlag_pl,
if(InQuarterToDate(TempDate, today(),0), 1, 0) as OutageStartDateCal.CurQtrFlag_pl,
if(InMonthToDate(TempDate, today(),0), 1, 0) as OutageStartDateCal.CurMonthFlag_pl,
if(InYear(TempDate, today(),-1), 1, 0) as OutageStartDateCal.LastYearFlag_pl,
if(InQuarter(TempDate, today(),-1), 1, 0) as OutageStartDateCal.LastQtrFlag_pl,
if(InMonth(TempDate, today(),-1), 1, 0) as OutageStartDateCal.LastMonthFlag_pl
Resident TempCalendar
Order By TempDate ASC;
Drop Table TempCalendar;
Now in the Front end while in the chart expresiion as
NUM(AVG({<PERIOD_NAME_Pl=>} MID(THRESHOLD,3,len(THRESHOLD)-3))/100,'#,##0.0%')
The data is not reflection wth Year_PL_pl,Month_PL_pl
can you please help
- Mark as New
- Bookmark
- Subscribe
- Mute
- Subscribe to RSS Feed
- Permalink
- Report Inappropriate Content
let vMinDate = Num(yearstart(today(), -11));
let vMaxDate = Num(today());
- Mark as New
- Bookmark
- Subscribe
- Mute
- Subscribe to RSS Feed
- Permalink
- Report Inappropriate Content
You say that "in the chart it is not displaying". You don't get any data at all? Or your charts don't react to selections in the MasterCalendar? Or you get the wrong output?
- Mark as New
- Bookmark
- Subscribe
- Mute
- Subscribe to RSS Feed
- Permalink
- Report Inappropriate Content
Did you check all your fields in date table comes properly
Replace this variable
let vMinDate = Num(Addmonths(today(), -11));
- Mark as New
- Bookmark
- Subscribe
- Mute
- Subscribe to RSS Feed
- Permalink
- Report Inappropriate Content
If you required Yearstart for current year then this
let vMinDate = Num( YearStart( today() ) );
- Mark as New
- Bookmark
- Subscribe
- Mute
- Subscribe to RSS Feed
- Permalink
- Report Inappropriate Content
As an aside, if you have only Period values in your facts tables, it isn't necessary to create a Day-based calendar. You can create one of the first of every month, resulting in a table with far fewer values.
- Mark as New
- Bookmark
- Subscribe
- Mute
- Subscribe to RSS Feed
- Permalink
- Report Inappropriate Content
Your PERIOD_NAME field is in text format, so your date number conversion is wrong, do the below, then I think it will work
Floor(DATE#(PERIOD_NAME,'MMM-YYYY')) as PERIOD_NAME_Pl