Unlock a world of possibilities! Login now and discover the exclusive benefits awaiting you.
- Qlik Community
- :
- All Forums
- :
- QlikView App Dev
- :
- percentage of each segment in Stacked Bar chart
- Subscribe to RSS Feed
- Mark Topic as New
- Mark Topic as Read
- Float this Topic for Current User
- Bookmark
- Subscribe
- Mute
- Printer Friendly Page
- Mark as New
- Bookmark
- Subscribe
- Mute
- Subscribe to RSS Feed
- Permalink
- Report Inappropriate Content
percentage of each segment in Stacked Bar chart
Hello dears,
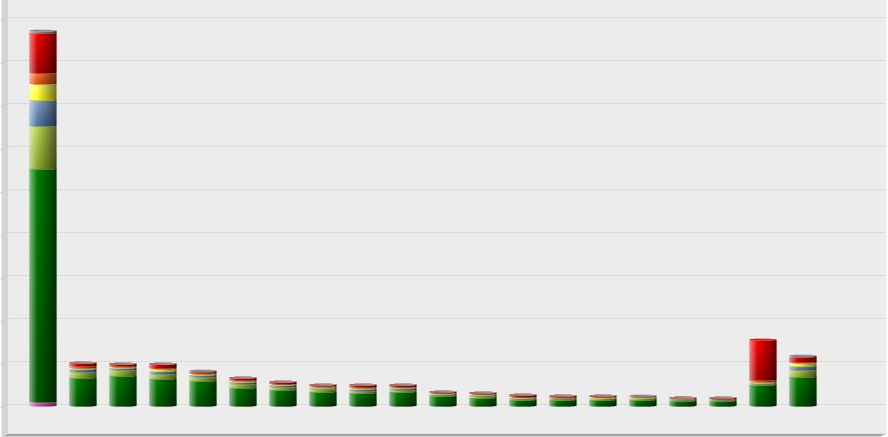
My Data set is about status of customers in the different countries, I have added Countries and CustomerStatus fields as dimensions and Count the customers in the expression. to see the percentage of each status in country i set the expression as : count(customers)/count(total customers)
as you can see in the below image, I have a Stacked bar chart. the problem is the number of customers in each country affects the height of bars, i want to see all the bars at an equal height and instead see the percentage of each status in the bar.
how can i do that?
- « Previous Replies
-
- 1
- 2
- Next Replies »
Accepted Solutions
- Mark as New
- Bookmark
- Subscribe
- Mute
- Subscribe to RSS Feed
- Permalink
- Report Inappropriate Content
Check enclosed file...
- Mark as New
- Bookmark
- Subscribe
- Mute
- Subscribe to RSS Feed
- Permalink
- Report Inappropriate Content
Create a Bar Chart
Dimension
Country
CustomerStatus
Expression
1)
Just Write
1
Tick Bar and Untick Values on Data Point
2)
count(customers)/count(total customers)
or
Count(customers)
and Tick Relative
Now Untick Bar and Tick Values on Data point..
Update:
Now go to presentation tab and select plot values inside segments...
- Mark as New
- Bookmark
- Subscribe
- Mute
- Subscribe to RSS Feed
- Permalink
- Report Inappropriate Content
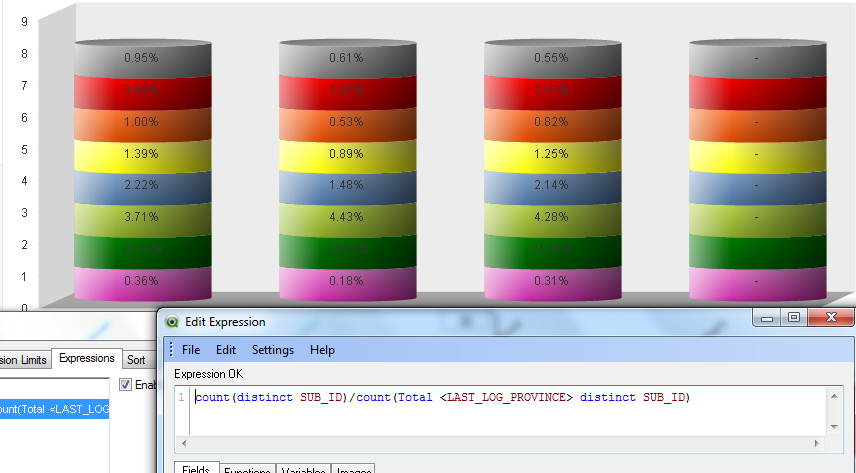
count(customers)/count(total <countries >customers)
or
count(customers)/count(total <countries, CustomerStatus>customers)
- Mark as New
- Bookmark
- Subscribe
- Mute
- Subscribe to RSS Feed
- Permalink
- Report Inappropriate Content
Hi,
Go to chart properties --> sort --> Select sort by Y value.
Regards
ASHFAQ
- Mark as New
- Bookmark
- Subscribe
- Mute
- Subscribe to RSS Feed
- Permalink
- Report Inappropriate Content
on tab Expressions check "Values on Data Points"
on tab Presentation check "Plot Values inside segements"
- Mark as New
- Bookmark
- Subscribe
- Mute
- Subscribe to RSS Feed
- Permalink
- Report Inappropriate Content
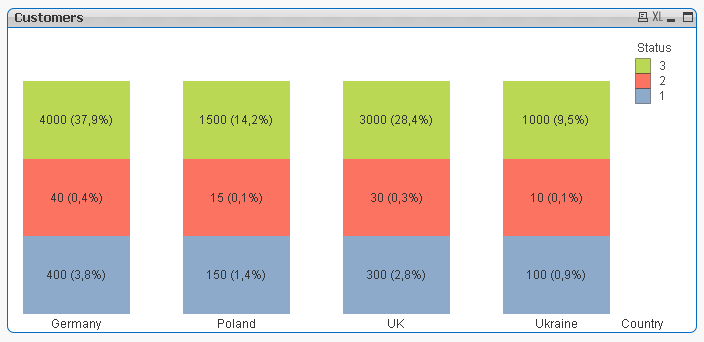
as i understand you need something like at the image below. You can use Dual function. See attachment. if you need percentage for particular country - change expression to: sum(Customers) / sum(total<Country> Customers)
- Mark as New
- Bookmark
- Subscribe
- Mute
- Subscribe to RSS Feed
- Permalink
- Report Inappropriate Content
That's great, but why the aggregate of segments percentage in each bar isn't 100%? i need to have the percentage of each segment in each country.
- Mark as New
- Bookmark
- Subscribe
- Mute
- Subscribe to RSS Feed
- Permalink
- Report Inappropriate Content
Check enclosed file...
- Mark as New
- Bookmark
- Subscribe
- Mute
- Subscribe to RSS Feed
- Permalink
- Report Inappropriate Content
i did exactly what you told me, i just don't get it what i missed. what did you do to get the right chart?
- Mark as New
- Bookmark
- Subscribe
- Mute
- Subscribe to RSS Feed
- Permalink
- Report Inappropriate Content
What are the dimensions names you used?
Looks like you have used Calculated Dimension
- « Previous Replies
-
- 1
- 2
- Next Replies »