Unlock a world of possibilities! Login now and discover the exclusive benefits awaiting you.
Announcements
FLASH SALE: Save $500! Use code FLASH2026 at checkout until Feb 14th at 11:59PM ET. Register Now!
- Qlik Community
- :
- All Forums
- :
- QlikView App Dev
- :
- Re: pivot table
Options
- Subscribe to RSS Feed
- Mark Topic as New
- Mark Topic as Read
- Float this Topic for Current User
- Bookmark
- Subscribe
- Mute
- Printer Friendly Page
Turn on suggestions
Auto-suggest helps you quickly narrow down your search results by suggesting possible matches as you type.
Showing results for
Creator II
2015-10-01
07:34 AM
- Mark as New
- Bookmark
- Subscribe
- Mute
- Subscribe to RSS Feed
- Permalink
- Report Inappropriate Content
pivot table
hi
this is what i need and hope you can help have a pivot table:
| Expression 1 | Expression 2 |
| 6% | 7% |
| 7% | 5% |
| 5% | 7% |
| 8% | 10% |
| 1% | 1.5% |
i need a red color in Expression 2 is Expression 2 greater then 1% of Expression 1
| Expression 1 | Expression 2 |
| 6% | 7% |
| 7% | 5% |
| 5% | 7% |
| 8% | 10% |
| 1% | 1.5% |
Any one can help ?
- Tags:
- new_to_qlikview
320 Views
2 Replies
Specialist II
2015-10-01
08:19 AM
- Mark as New
- Bookmark
- Subscribe
- Mute
- Subscribe to RSS Feed
- Permalink
- Report Inappropriate Content
Hi,
Goto Expressions tab-> Select your Second Expression -> Expand it by clicking + -> Selct Text Color-> Write your Expression like this.
If(Sum( Field in Expression 2)> Sum(Field in Expression1), Red(), Black())
273 Views
Champion III
2015-10-01
08:20 AM
- Mark as New
- Bookmark
- Subscribe
- Mute
- Subscribe to RSS Feed
- Permalink
- Report Inappropriate Content
Try like shown in the image below:
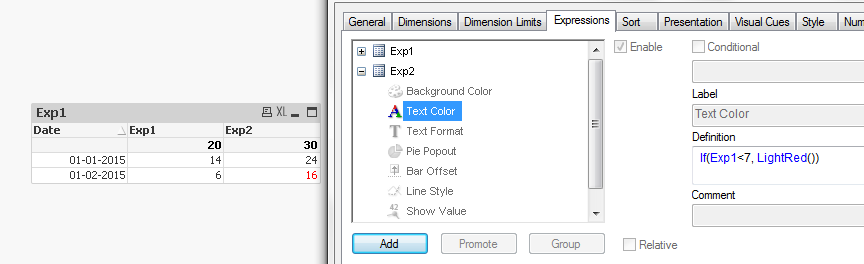
Note: Exp1, Exp2 are actually labels of the expressions. For %, you might have to compare like: If ( (Exp1*10)>1, red())
273 Views