Unlock a world of possibilities! Login now and discover the exclusive benefits awaiting you.
- Qlik Community
- :
- All Forums
- :
- QlikView App Dev
- :
- Re: population pyramid?
- Subscribe to RSS Feed
- Mark Topic as New
- Mark Topic as Read
- Float this Topic for Current User
- Bookmark
- Subscribe
- Mute
- Printer Friendly Page
- Mark as New
- Bookmark
- Subscribe
- Mute
- Subscribe to RSS Feed
- Permalink
- Report Inappropriate Content
population pyramid?
How we can Create a Population Pyramid in Graph Format in QlikView?
Thanks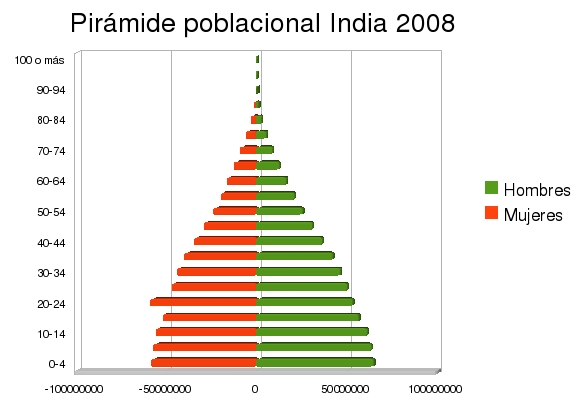
- Mark as New
- Bookmark
- Subscribe
- Mute
- Subscribe to RSS Feed
- Permalink
- Report Inappropriate Content
Hello Federico,
Unfortunaetely it is not possible in Qlikviiew. There is no specific chart type available in qlikview world.
Above pyramid is nothing but the graphical representation of the age and gender or may be some particular dimensions based of facts.
I would like to recommend you Bar chart or Combo chart as this will represent the entire information.
Thank You
Advait
https://www.linkedin.com/groups/6513382/
- Mark as New
- Bookmark
- Subscribe
- Mute
- Subscribe to RSS Feed
- Permalink
- Report Inappropriate Content
- Mark as New
- Bookmark
- Subscribe
- Mute
- Subscribe to RSS Feed
- Permalink
- Report Inappropriate Content
Hi,
I've created a tutorial that includes a population pyramid. You can access the whole of the tutorial here: QlikView 11 Developer Tutorial - the population pyramid piece is here: QlikView 11 Developer Tutorial - part 8
Mike
- Mark as New
- Bookmark
- Subscribe
- Mute
- Subscribe to RSS Feed
- Permalink
- Report Inappropriate Content
should be possible with horizontal, stacked bar charts with offset expressions
- Mark as New
- Bookmark
- Subscribe
- Mute
- Subscribe to RSS Feed
- Permalink
- Report Inappropriate Content
Hello Everyone here,
This is to quickly inform you that this has been achieved last year by using Bar Chart (Orientation- Stacked).
Unfortunately could not get time to post here. Please have a glance on attached file.
Regards
Advait
https://www.linkedin.com/groups/6513382/