Unlock a world of possibilities! Login now and discover the exclusive benefits awaiting you.
- Qlik Community
- :
- All Forums
- :
- QlikView App Dev
- :
- Re: problem with total label in pivot table
- Subscribe to RSS Feed
- Mark Topic as New
- Mark Topic as Read
- Float this Topic for Current User
- Bookmark
- Subscribe
- Mute
- Printer Friendly Page
- Mark as New
- Bookmark
- Subscribe
- Mute
- Subscribe to RSS Feed
- Permalink
- Report Inappropriate Content
problem with total label in pivot table
Hi Community,
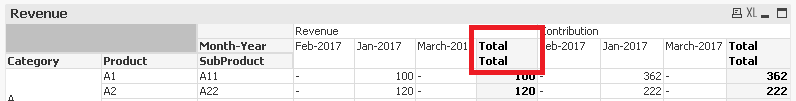
I have a pivot table, which shows partial sums for the third dimension i.e Month-Year.
Total label showing twice.
Thanks in Advance...
- « Previous Replies
-
- 1
- 2
- Next Replies »
- Mark as New
- Bookmark
- Subscribe
- Mute
- Subscribe to RSS Feed
- Permalink
- Report Inappropriate Content
Hello, Raju!
Here you go!
- Mark as New
- Bookmark
- Subscribe
- Mute
- Subscribe to RSS Feed
- Permalink
- Report Inappropriate Content
Hi,
I am facing the same issue, Total comes twice as Label. & I am using Personal Edition, unable to open your file "Pivot.qvw".
Can you suggest the logic/ procedure for the same?
- Mark as New
- Bookmark
- Subscribe
- Mute
- Subscribe to RSS Feed
- Permalink
- Report Inappropriate Content
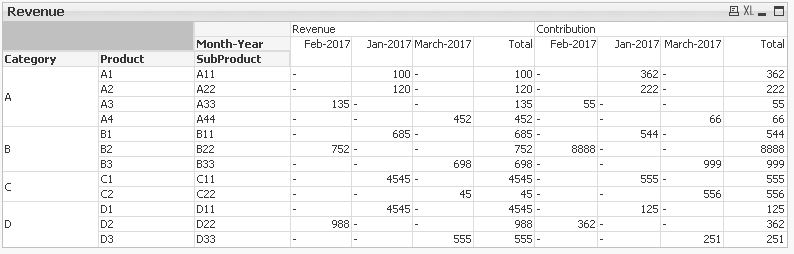
Here is what serj_shu did
t:
LOAD * INLINE [
Category, Product, SubProduct, Revenue, Contribution, Month-Year
A, A1, A11, 100, 362, Jan-2017
A, A2, A22, 120, 222, Jan-2017
A, A3, A33, 135, 55, Feb-2017
A, A4, A44, 452, 66, March-2017
B, B1, B11, 685, 544, Jan-2017
B, B2, B22, 752, 8888, Feb-2017
B, B3, B33, 698, 999, March-2017
C, C1, C11, 4545, 555, Jan-2017
C, C2, C22, 45, 556, March-2017
D, D1, D11, 4545, 125, Jan-2017
D, D2, D22, 988, 362, Feb-2017
D, D3, D33, 555, 251, March-2017
];
Join (t)
LOAD Category, Product, SubProduct, 'Total' as [Month-Year], sum(Revenue) as Revenue, sum(Contribution) as Contribution Resident t
Group by Category, Product, SubProduct;
he essentially pre-aggregate the total in the script.... but this may slow down your script...
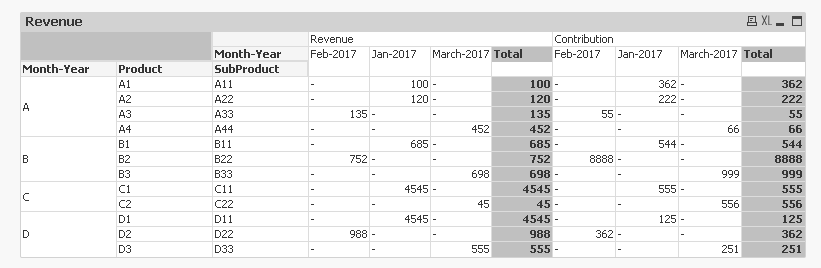
Here is an alternative
LOAD * INLINE [
Category, Product, SubProduct, Revenue, Contribution, Month-Year
A, A1, A11, 100, 362, Jan-2017
A, A2, A22, 120, 222, Jan-2017
A, A3, A33, 135, 55, Feb-2017
A, A4, A44, 452, 66, March-2017
B, B1, B11, 685, 544, Jan-2017
B, B2, B22, 752, 8888, Feb-2017
B, B3, B33, 698, 999, March-2017
C, C1, C11, 4545, 555, Jan-2017
C, C2, C22, 45, 556, March-2017
D, D1, D11, 4545, 125, Jan-2017
D, D2, D22, 988, 362, Feb-2017
D, D3, D33, 555, 251, March-2017
];
Dim:
LOAD * Inline [
Dim
1
2
];
Where Dim is going to be island table and then do this
Dimensions
Category
Product
SubProduct
=Pick(Dim, [Month-Year], 'Total')
Expressions
Sum(Revenue)
Sum(Contribution)
Background Color expression for both your expressions and the last calculated dimension
=If(Dim = 2, RGB(192,192,192))
Text format for both your expressions and the last calculated dimension
=If(Dim = 2, '<b>')
- Mark as New
- Bookmark
- Subscribe
- Mute
- Subscribe to RSS Feed
- Permalink
- Report Inappropriate Content
Hi @Sunny
In my case, I am using Total column with Aggr function.
Can you help, how to handle such conditions.
- Mark as New
- Bookmark
- Subscribe
- Mute
- Subscribe to RSS Feed
- Permalink
- Report Inappropriate Content
With Aggr? Can you elaborate a little on this?
- Mark as New
- Bookmark
- Subscribe
- Mute
- Subscribe to RSS Feed
- Permalink
- Report Inappropriate Content
Hi,
My report is related to Revenue per employee, (Hotel Data & HR Data).
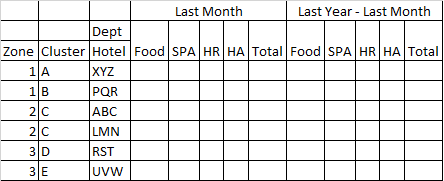
Last Month & Last Year - Last month are my expression, while Zone, Cluster and Hotel are dimensions, and Dept is my calculated dimension.
So, In Expression I am using , Sum(revenue) / Count(Emp).
But for total column it sholud be the SUM of all department revenue per employee value.
To get such value as total, I am using Aggr function.
- Mark as New
- Bookmark
- Subscribe
- Mute
- Subscribe to RSS Feed
- Permalink
- Report Inappropriate Content
Again, I don't see (or understand) the problem, would you be able to share a qvw sample to show your issue?
- Mark as New
- Bookmark
- Subscribe
- Mute
- Subscribe to RSS Feed
- Permalink
- Report Inappropriate Content
Total Sub-Column of Last Month should give :: Sum of (Food + SPA + HR +HA) values i.e. Revenue per Employee.
But according to our logic it is giving over all revenue divide by all number of employees.
I want actual value marked by red circle in below image, but i am getting by formula value: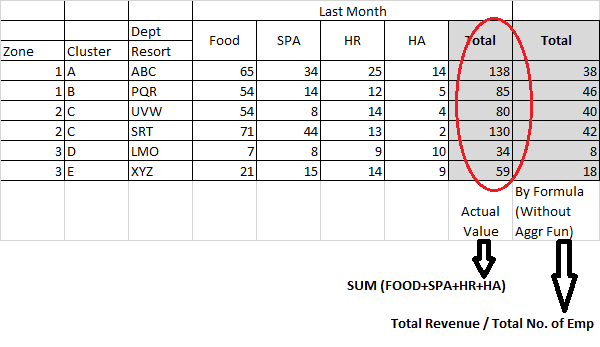
- Mark as New
- Bookmark
- Subscribe
- Mute
- Subscribe to RSS Feed
- Permalink
- Report Inappropriate Content
Would you be able to share the above data in an Excel format?
- Mark as New
- Bookmark
- Subscribe
- Mute
- Subscribe to RSS Feed
- Permalink
- Report Inappropriate Content
In Expression, I am using SUM(Revenue) / Count(EMP_ID)
- « Previous Replies
-
- 1
- 2
- Next Replies »